One in 27
Behind the scenes of a data story on child mortality, made with ONE Data

No one wants to talk about dying children. Not at dinner, not on LinkedIn, and ideally not ever.
But the topics we avoid talking about don’t get attention. In global health, attention is what impacts budgets and policies. If we want child deaths to keep falling, and perhaps one day to become truly rare everywhere, someone has to keep publishing the numbers. In an impactful way.
That was our brief.

In this edition of The Plot, I’ll take you behind the scenes of a piece we helped create for ONE Data about under-5 child mortality.
The numbers need attention. In 2024, one child in 27 died before turning five. That is the best that figure has ever been, but it still amounts to almost five million children a year. Progress has been slowing since 2015, and the goal of ending preventable child deaths by 2030 is uncertain.
To tell this story well, we relied on three techniques: the narrative, the illustrations, and the balance. Let’s dive deeper into them.
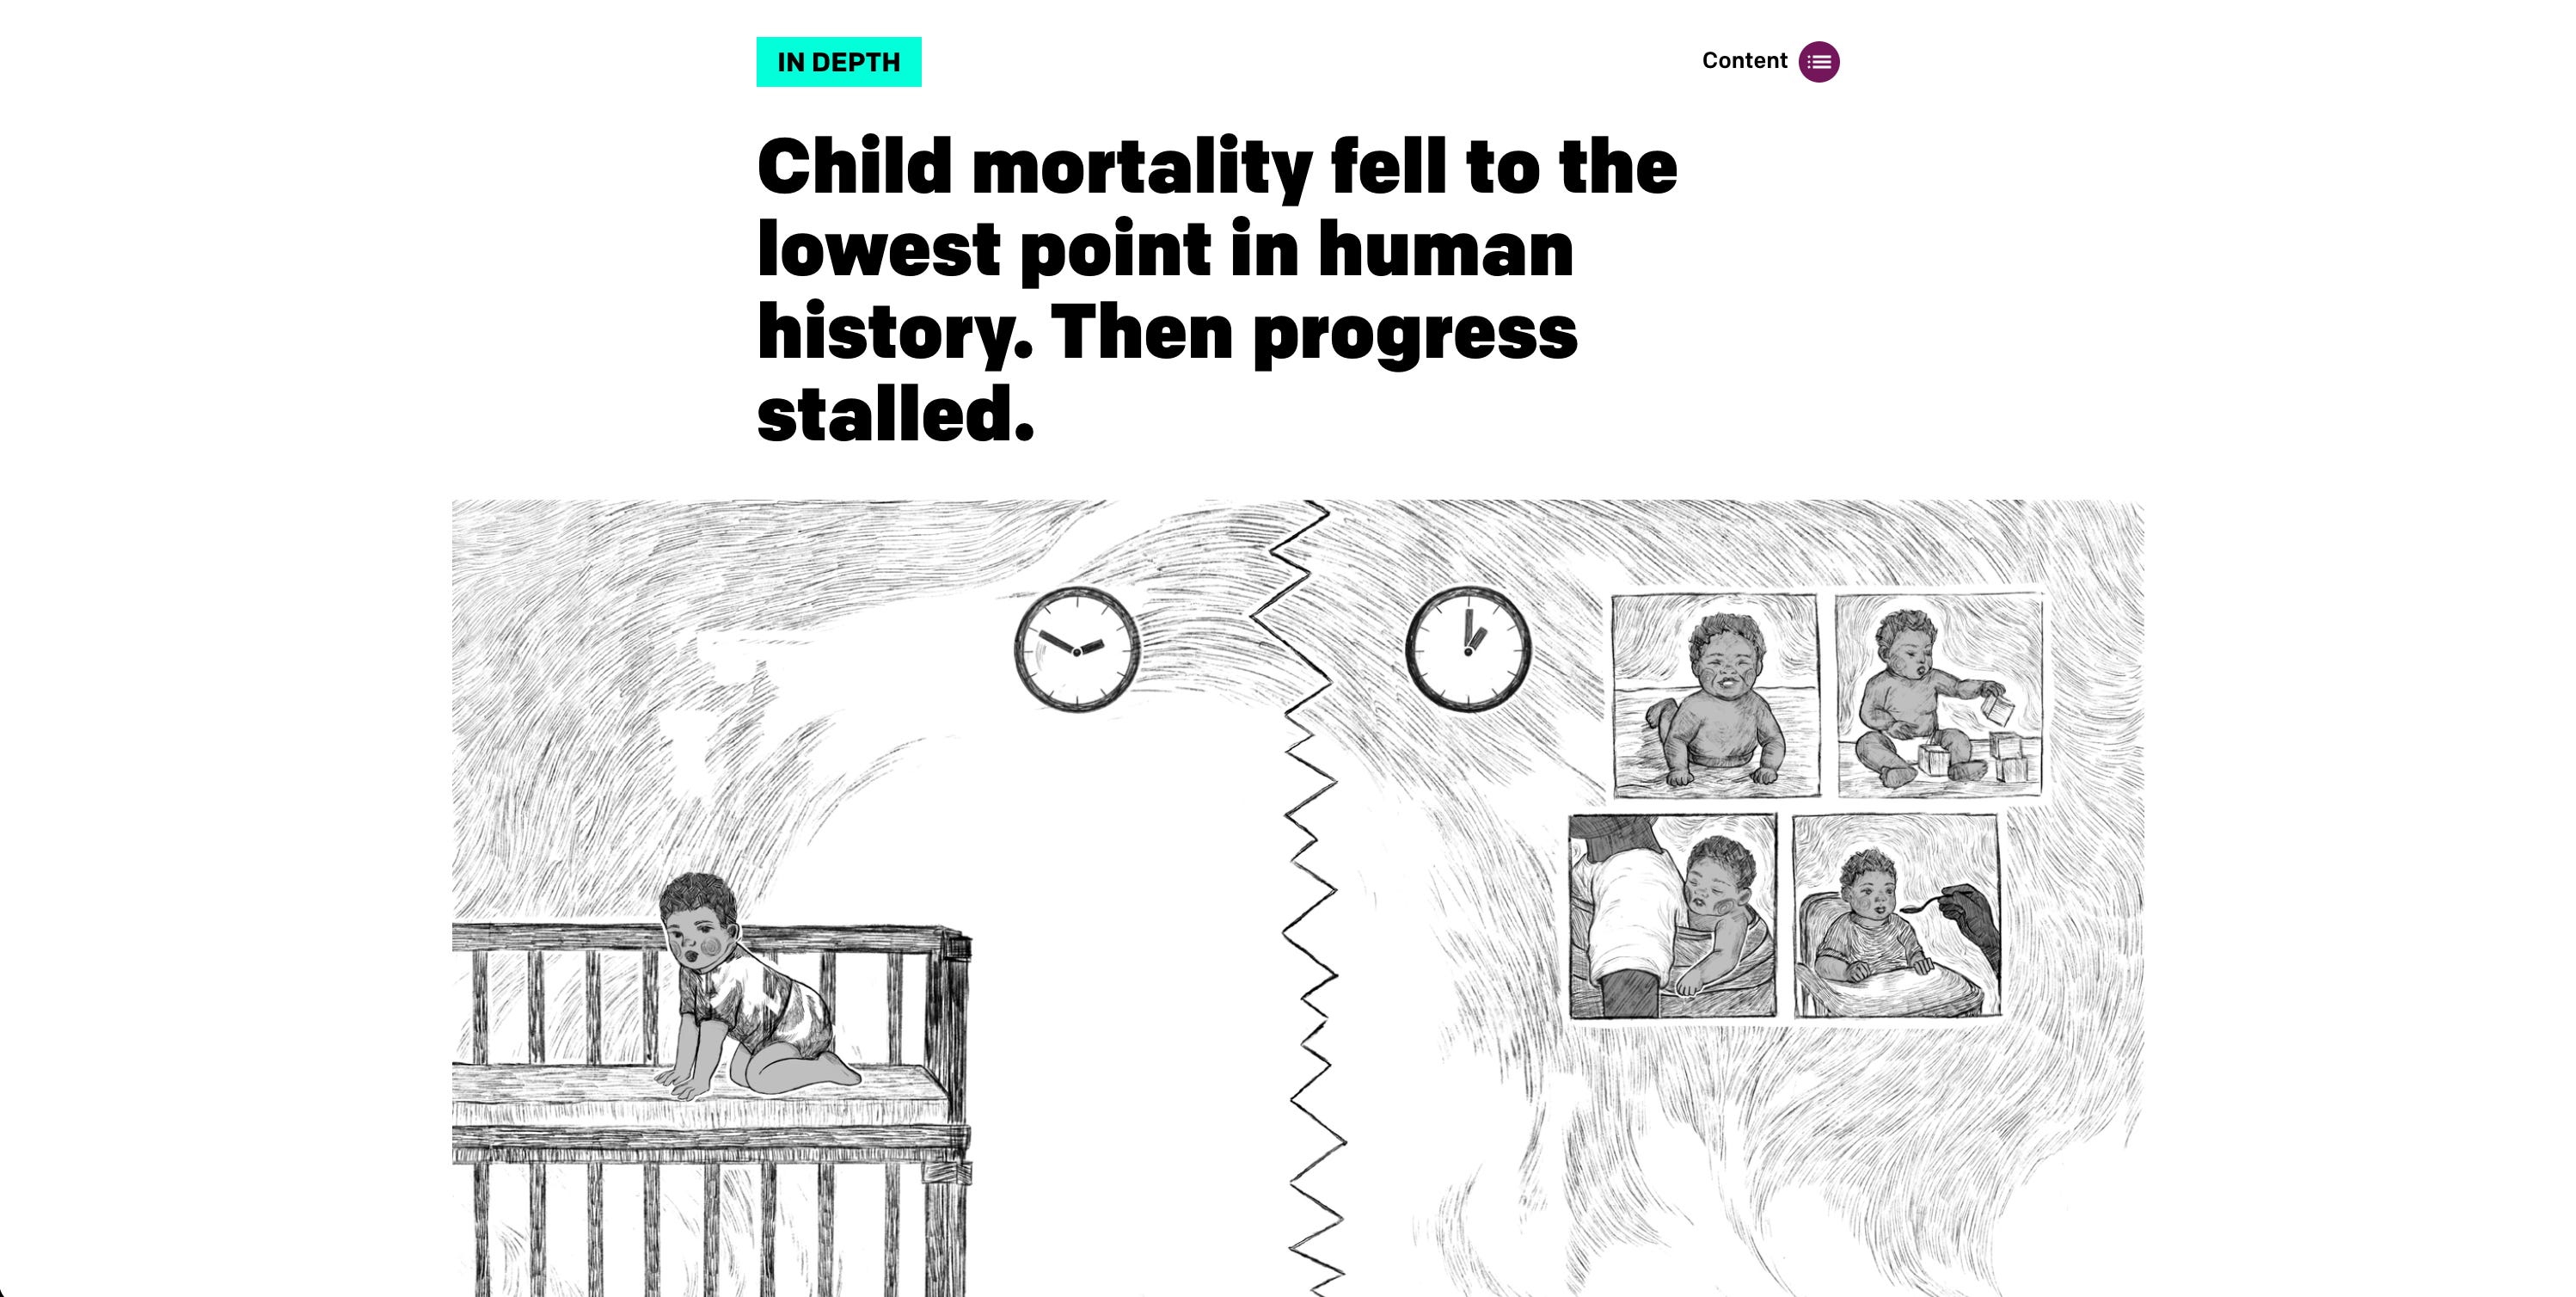
The narrative: two boys and their odds
Narrative always comes first (if you’ve been reading this newsletter for a while, you’ve heard me repeat that incessantly!). For this piece, we built the storyline around two boys and their survival odds.
At the same moment, Aksel is born in Oslo and Abakar in N’Djamena. Same weight, same cries, same waiting room full of people who would do anything for them. The main difference is that Abakar is about 39 times more likely to die before his fifth birthday.
These figures gave us the language of odds, which we used as a through-line:
Context. How the odds got this good: child mortality fell for two centuries, from more than two newborns in five dying in 1800 to one in 27 today. And how, around 2015, that progress began to stall.
Climax. Where the odds are worst and why: in 2024, sub-Saharan Africa carried 58% of the world’s child deaths, mostly from causes we already know how to prevent or treat.
Closure. What tips the odds, from vaccines to medical innovations to community health workers, and a hopeful future where both boys grow up.
We return to the boys and their odds at every turn of the story. The arc moves through the problem and its solutions, and ends with the moment the whole piece is built around: the fifth birthday.
The illustrations: pencil sketches
How do you illustrate a story whose subject is a dying child? That was a tough choice. Real photographs felt exploitative. Stock imagery felt lifeless. But charts alone felt cold for a story that is, at its core, about love and loss.
So we went with hand-drawn pencil sketches, in the spirit of the illustrations you’d find in old children’s books. We worked to recreate the visual language of childhood itself: soft, warm, a little timeless.
When you explore the story, you’ll notice that, even in these gentle illustrations, we were never explicit. The loss of a child is represented as a memory—instead of seeing him grow up, Abakar’s parents hang pictures of him on the wall.
The balance: navigating truth and respect
A story like this can fail in two ways. If it’s too soft, it won’t reflect the gravity of the situation. If it’s too hard, it will scare the readers off. So we tried to find a balance.
First, by staying hopeful. The piece contains the difficult numbers that need to be in there. But no section is purely negative: we focus on a cause that has a fix, or a country that proves change is possible. The reader will only be able to act if they see possible solutions.
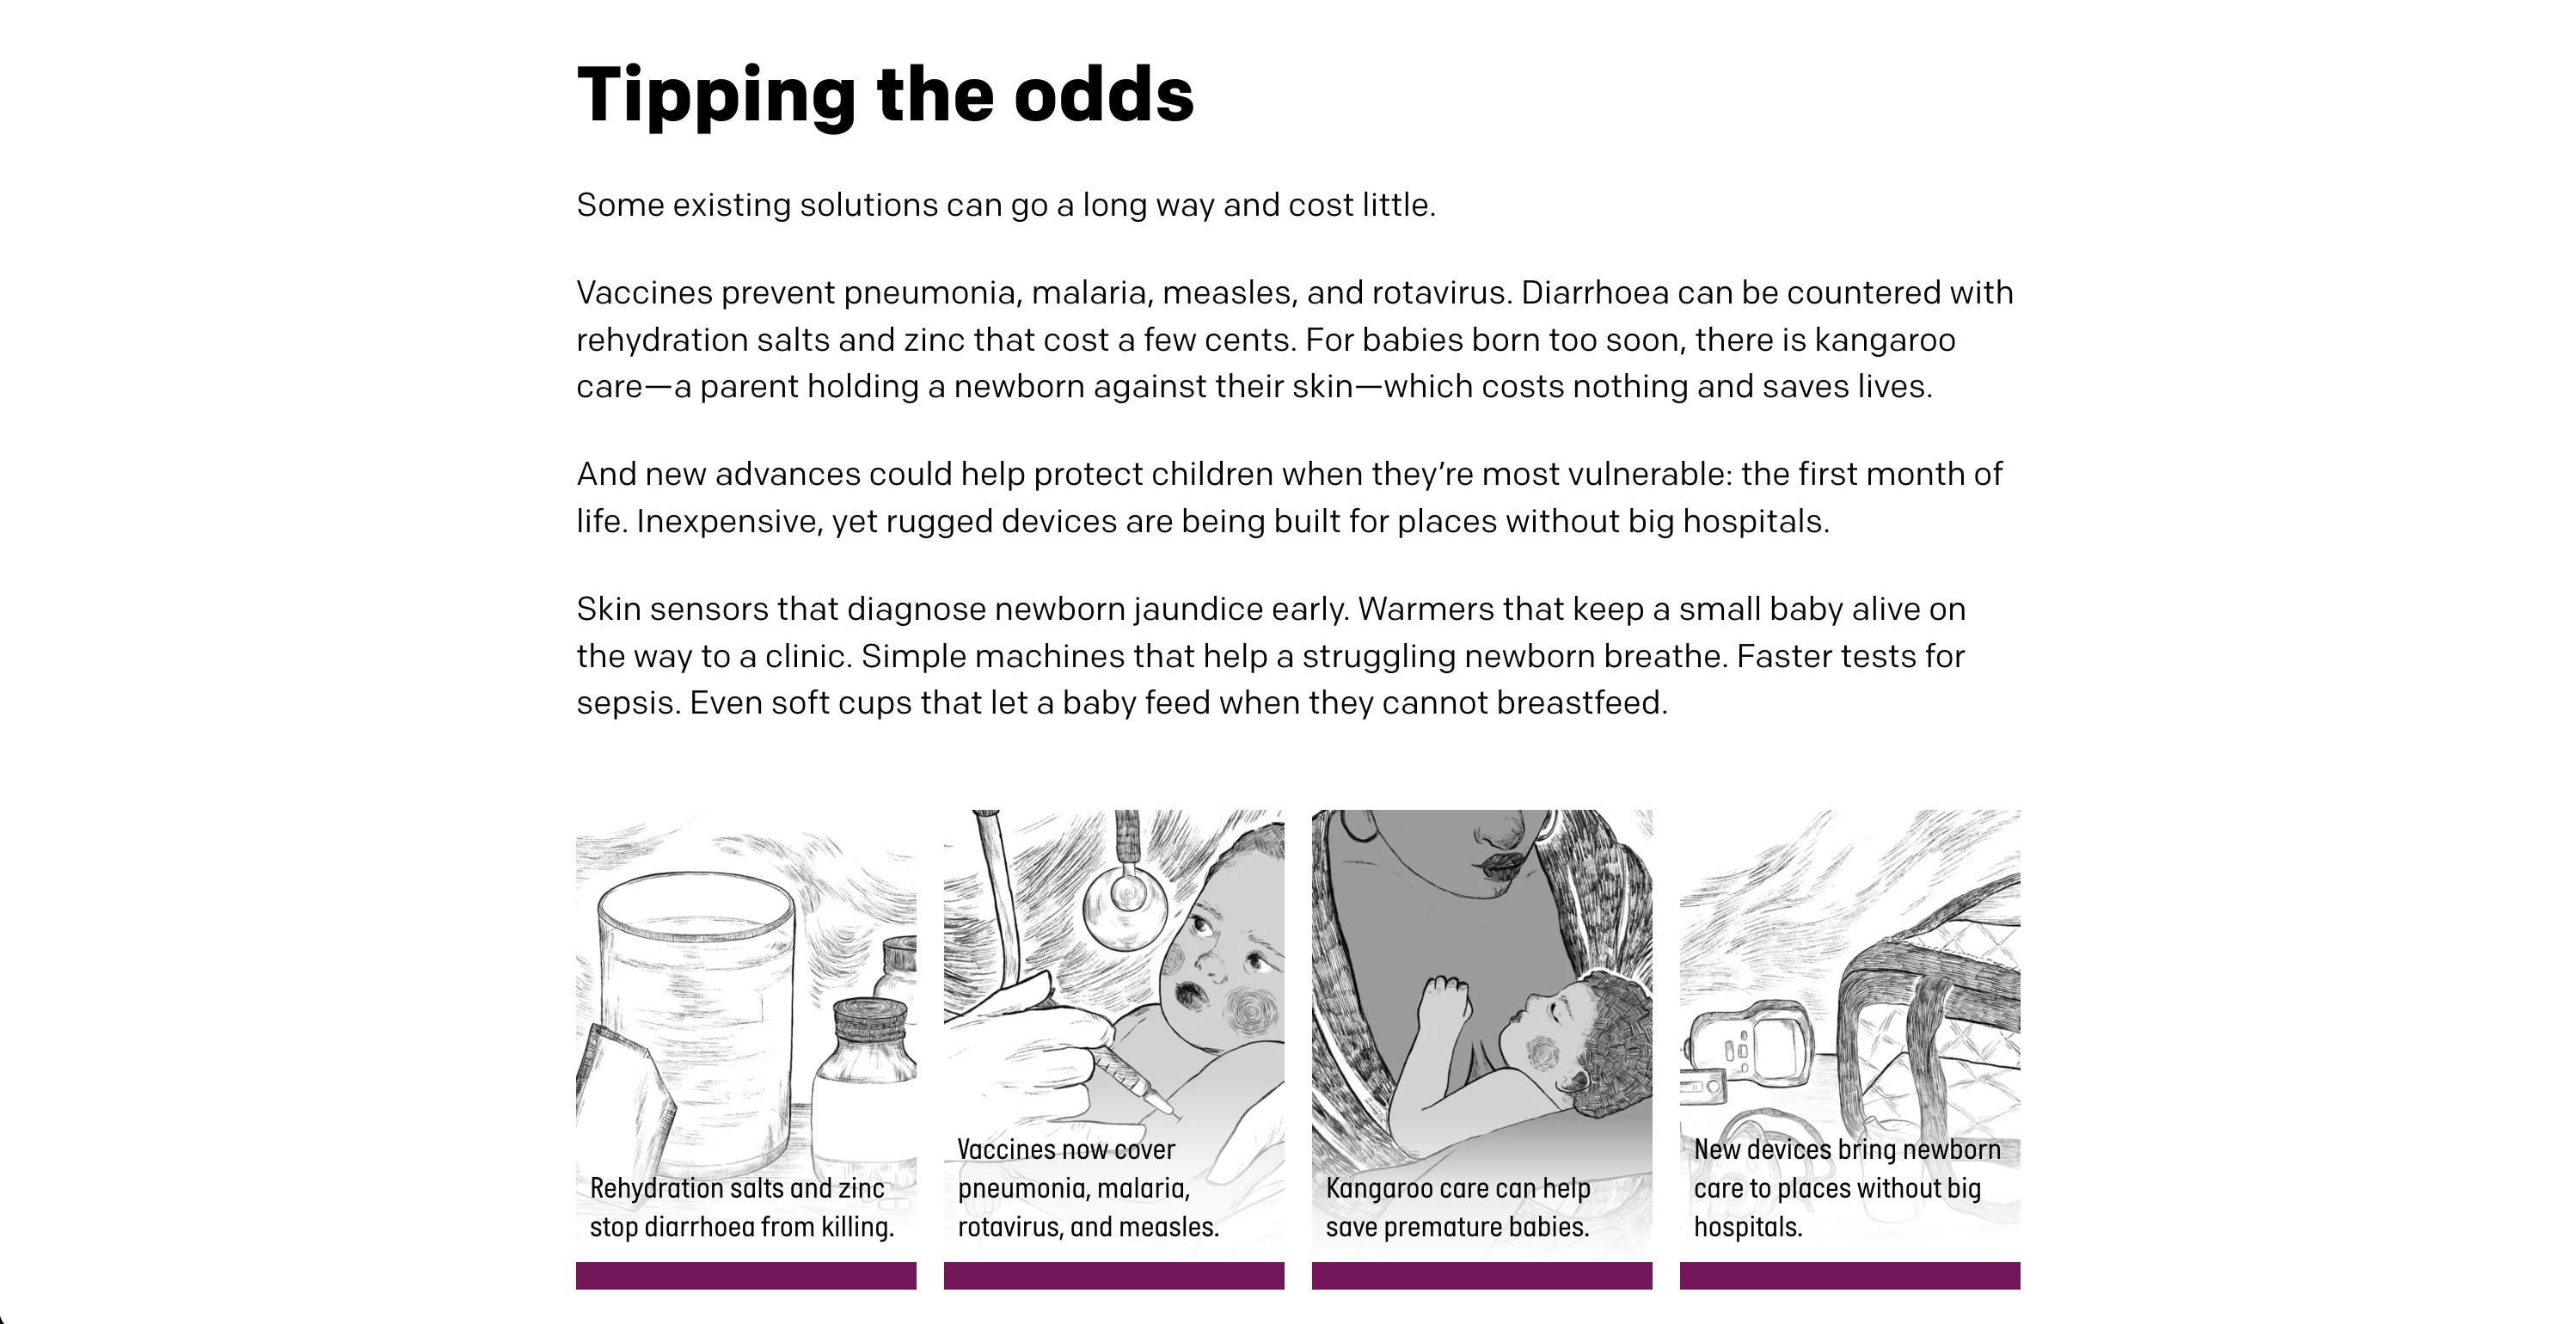
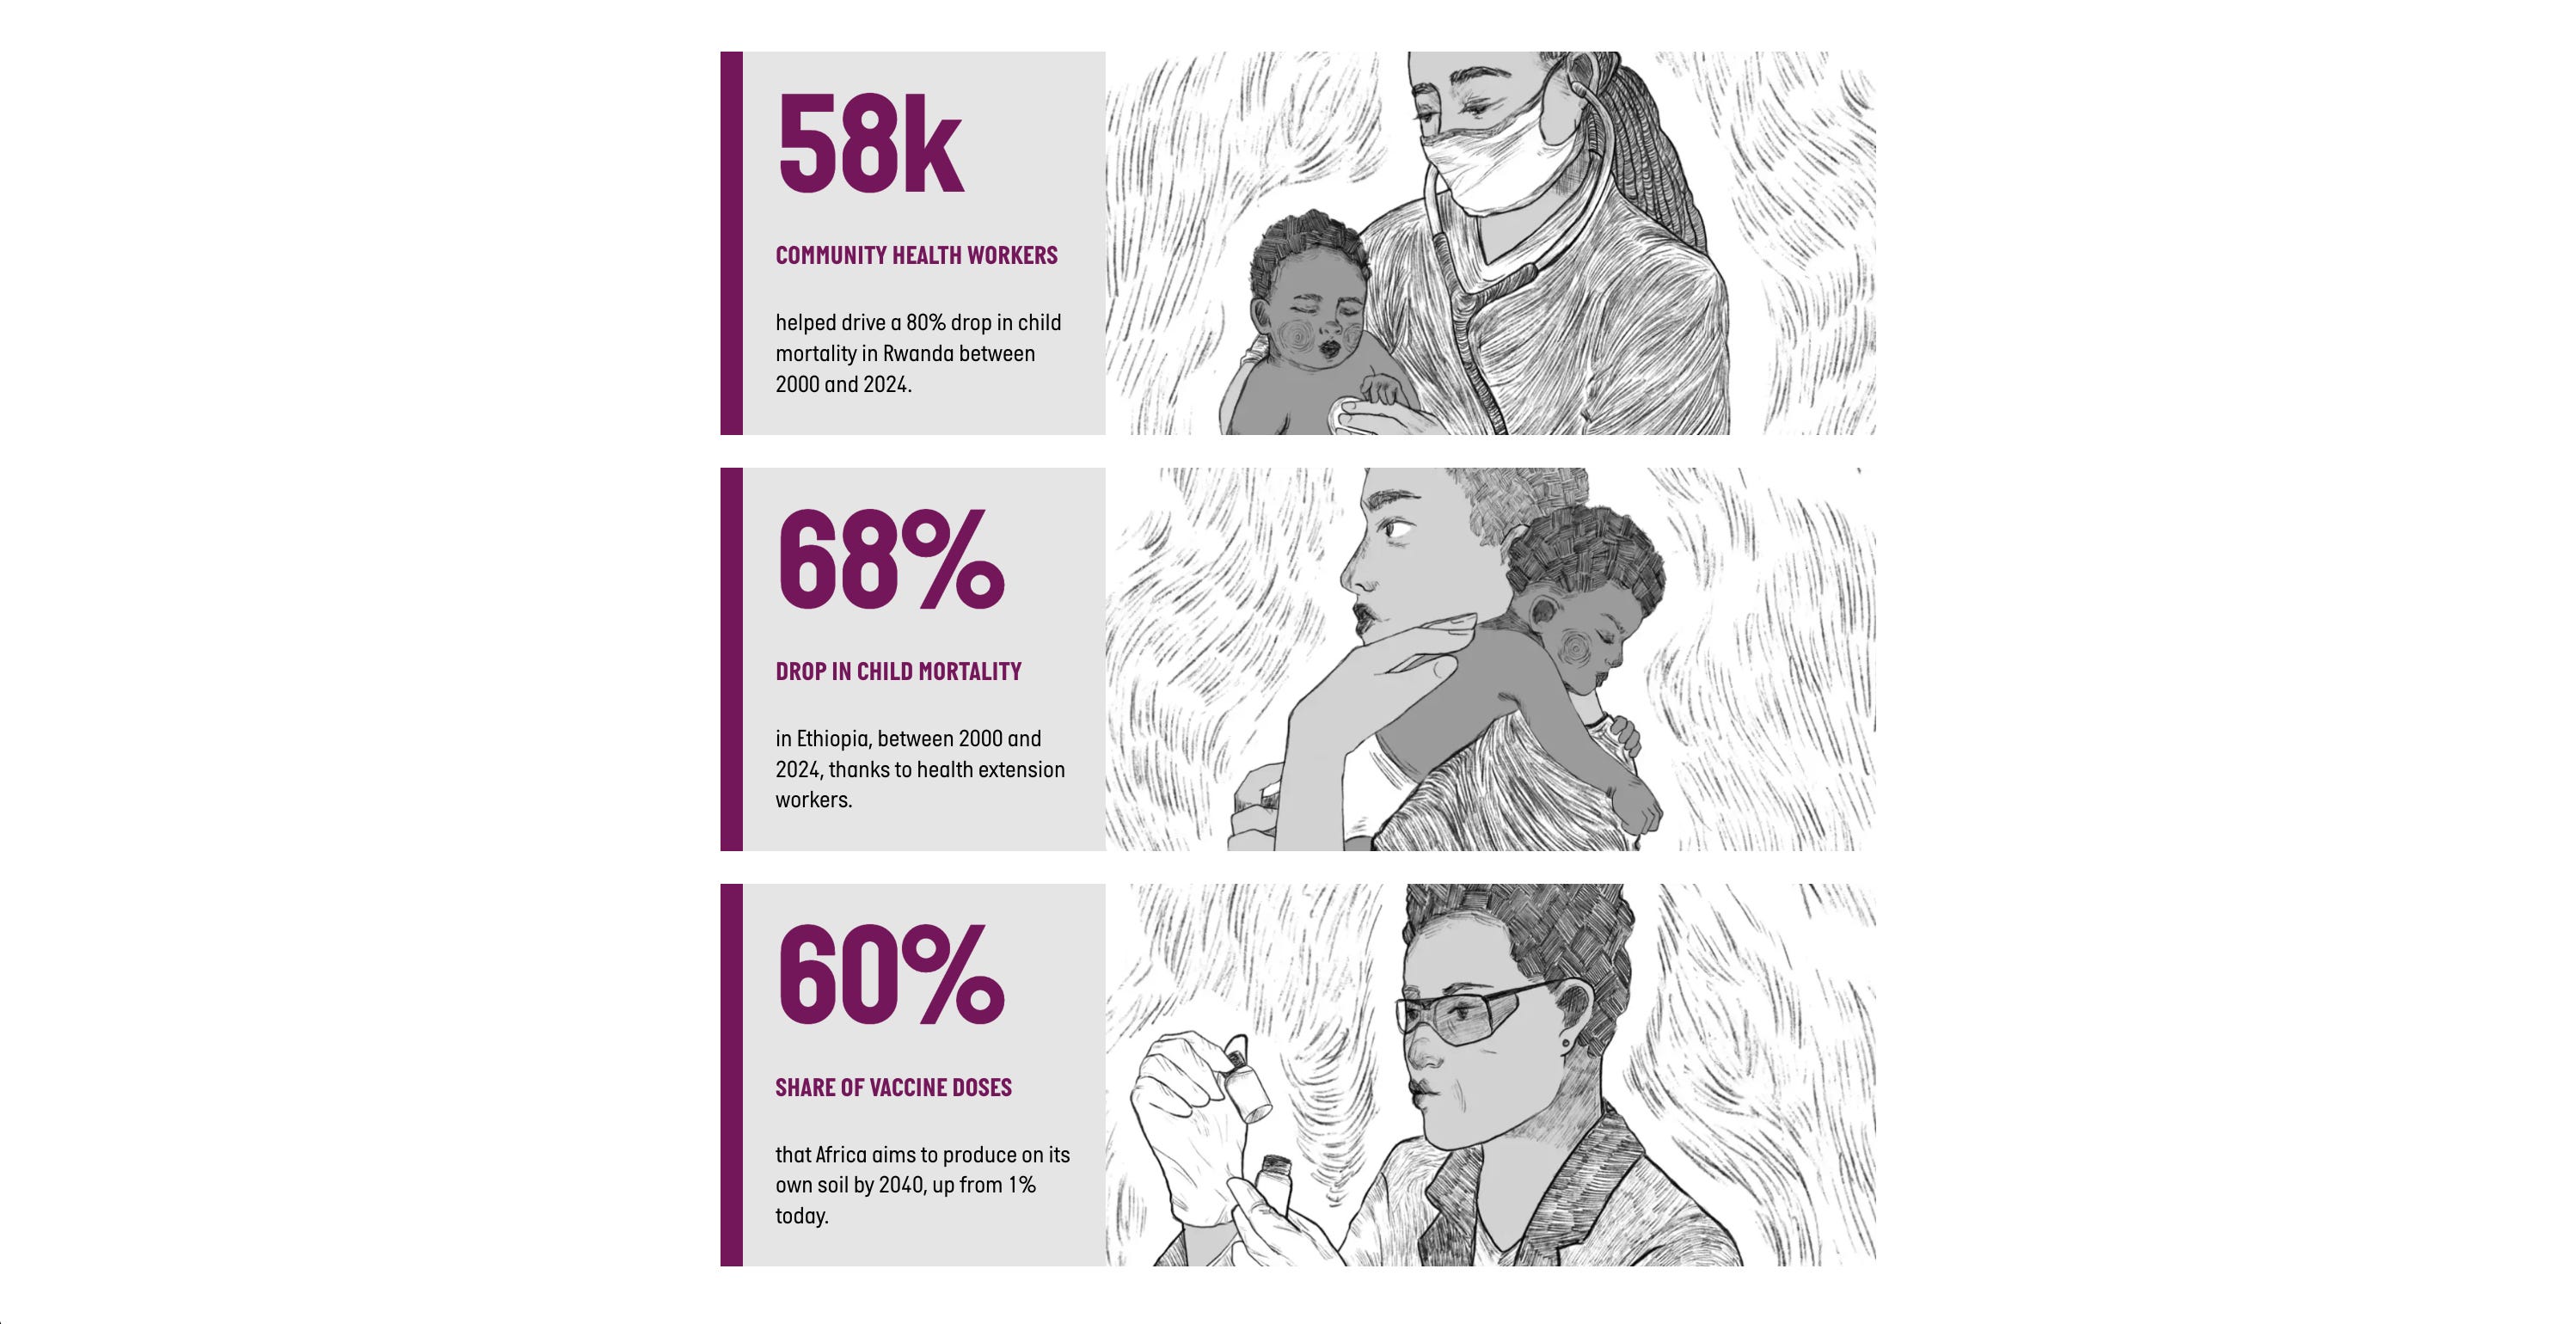
Second, by showing respect to people. The data is unambiguous: a big portion of the burden is concentrated in sub-Saharan Africa. The story has to say so. But we worked hard to not make it sound like “look how bad things are over there”. Instead, we highlighted that the countries with the toughest odds are also producing the fastest progress: Rwanda cut child deaths by 79% in a generation, the largest drop recorded anywhere, and Africa CDC has committed the continent to producing 60% of its own vaccines by 2040. The story gives the region its agency.
***
When a sensitive subject is at hand, we need to work harder to include a nuanced narrative, visuals that soften without hiding, and language that respects both the data and the people behind it.
If your organisation is looking to publish a story like this, but doesn’t know where to start, drop me an email.
Thanks for reading!
See you next month,
Evelina
Discussion about this post