
10,000 hours
Your non-linear career path is actually your secret weapon

Since you're reading this newsletter, you likely work with data visualisation and storytelling. But how did you get here? What's your background?
Probably only a handful of you can say you have a formal education in data visualisation—maybe even a bachelor's or master's degree. Most of us have taken a more winding path of study and work experiences that brought us to where we are today. I worked with data analytics, public speaking, nonprofits, and event management, before all these experiences led me to data storytelling.
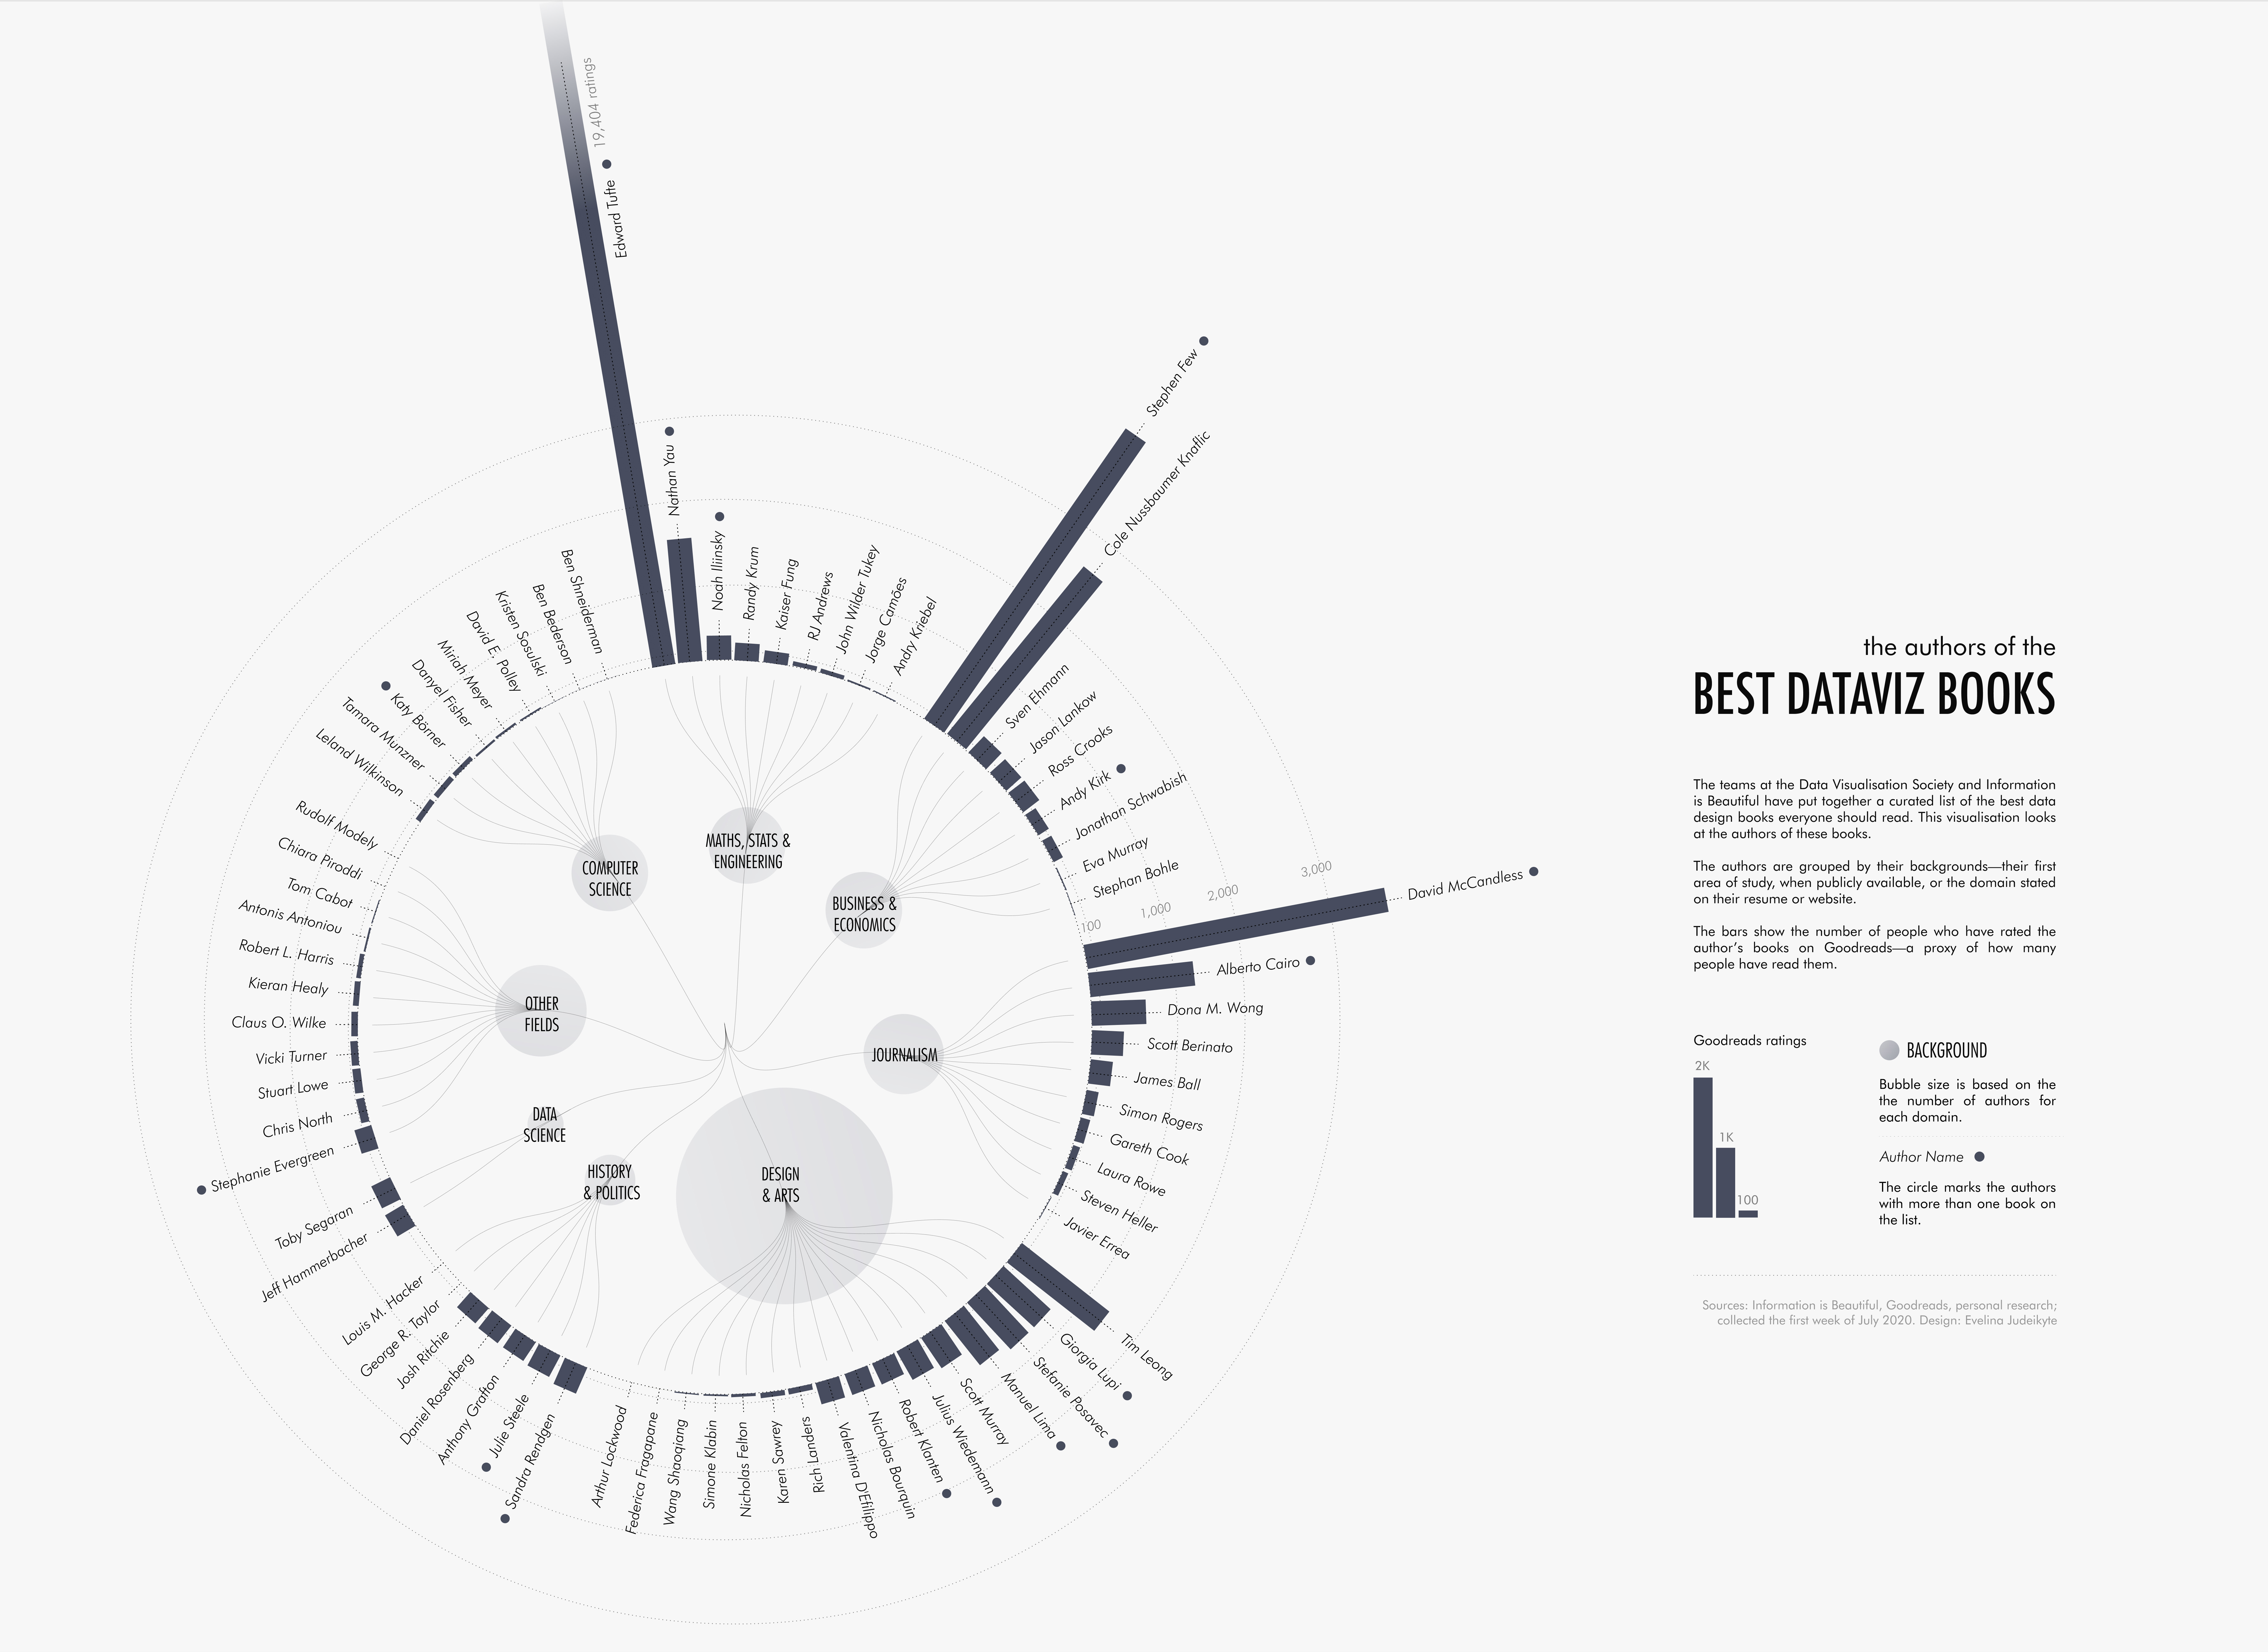
At the very beginning of my visualisation journey, I was curious about everyone else’s paths. So I created a chart (very meta, I know!) about the diverse fields that people in our community come from. While it’s somewhat biased—based on published book authors—it gives you an idea of how many different disciplines can lead to dataviz.
As a community, we know that having multiple experiences is an asset, yet somehow we’re not always super proud of these non-linear journeys. When I interview designers for the studio, they often apologetically say, "I studied something else first before finding a passion for data visualisation."
What could make us feel better about it? Some evidence, of course.
I recently finished reading Range by David Epstein where the author provided just the proof we need. What Epstein argues, with substantial evidence, is that trying different things before specialising in one area can actually make you a better specialist. In Range, we read stories of people we admire with unexpected career paths:
Roger Federer played quite a lot of different sports (including basketball, handball, soccer, badminton, and even skateboarding and swimming) before focusing on tennis
Vincent van Gogh worked as an art dealer, book store clerk and even religious missionary before finding his calling as a painter relatively late in life
Crazy, isn’t it? So perhaps we shouldn’t aim for 10,000 hours learning the same thing—a concept popularised by Malcolm Gladwell in Outliers, I’m sure you’ve heard of it—but splitting those hours up a little. What if you spent the first few thousand hours exploring before you double down on one specialty?
It could look something like this:
First, branch out: try different fields and sub-fields until you find “the one”
Then, spend a significant amount of time studying and practising that craft
Once mastery achieved, branch out again to keep learning
If you've been reading this newsletter for a while, you know I've gone deep down the rabbit hole of learning everything there is to know about data visualisation—evidenced by my large collection of books. But once I felt I'd covered most aspects of the topic, I started exploring other creative fields, and encourage my team to do the same. We regularly sharpen skills that are slightly adjacent to our core expertise—UX design, animation, branding and more. There’s always something to learn under the umbrella of data storytelling!
When you return to your primary field after exploring elsewhere, you'll bring fresh perspectives that make your work even better. So do take that winding path and wear it proudly as a badge!
Thanks for reading 💨
See you in two weeks,
—Evelina

I really love how many different backgrounds people in data viz come from. It means if you're interested, you can get into the field and thrive, regardless of what you studied, or what you've done.
Lovely article Evelina ☺️
Many thanks for sharing your insights! It is easier to read the article for me and the information on the article is quite informative. I should spare the time for reading your article in 2026!