What makes a story unforgettable?
We borrow story structure ideas from the media, the movies and great orators.
Border Hacker* is the most engaging book I read this year. I brought it with me to Costa Rica as a casual holiday read, and ended up devouring over 300 pages in just a few days. While outside during the day, I waited impatiently to get my hands (or eyes 😉) on the next chapter. In the evening, I read until my eyes literally closed shut for sleep.
I’m convinced that the success of the book is at least partly due to its structure. It pulls you in right away. Each chapter beginning feels like a new exciting story. And each chapter ending is as painful as a season finale cliffhanger on Netflix. So it got me thinking — what if our data stories were structured this well?
Structure, but how?
I’m sure you’ve been told at some point in your life that a story should have three parts. It has to include a beginning, a middle and an end. That’s a good basis for a story flow. But what should you put inside these three sections? That’s the tricky part. In this second newsletter of the storytelling series, I’ll share my three go-to resources for structuring data narratives.
Follow the media
You won’t be surprised to hear that journalists are great storytellers. They’re also often pioneers of innovation in data visualisation, and that includes structuring visual narratives. So it would be a shame not to learn from them! My favourite resource on narrative data structures in journalism is this talk by Gurman Bhatia. She explains five different story flows — from pyramids to martini glasses to kebabs and beyond. I think the inverted pyramid (shown below) is probably the most versatile. I trained the data team at Dior this summer to use it for their dashboards, and it worked great!

Get inspired by orators
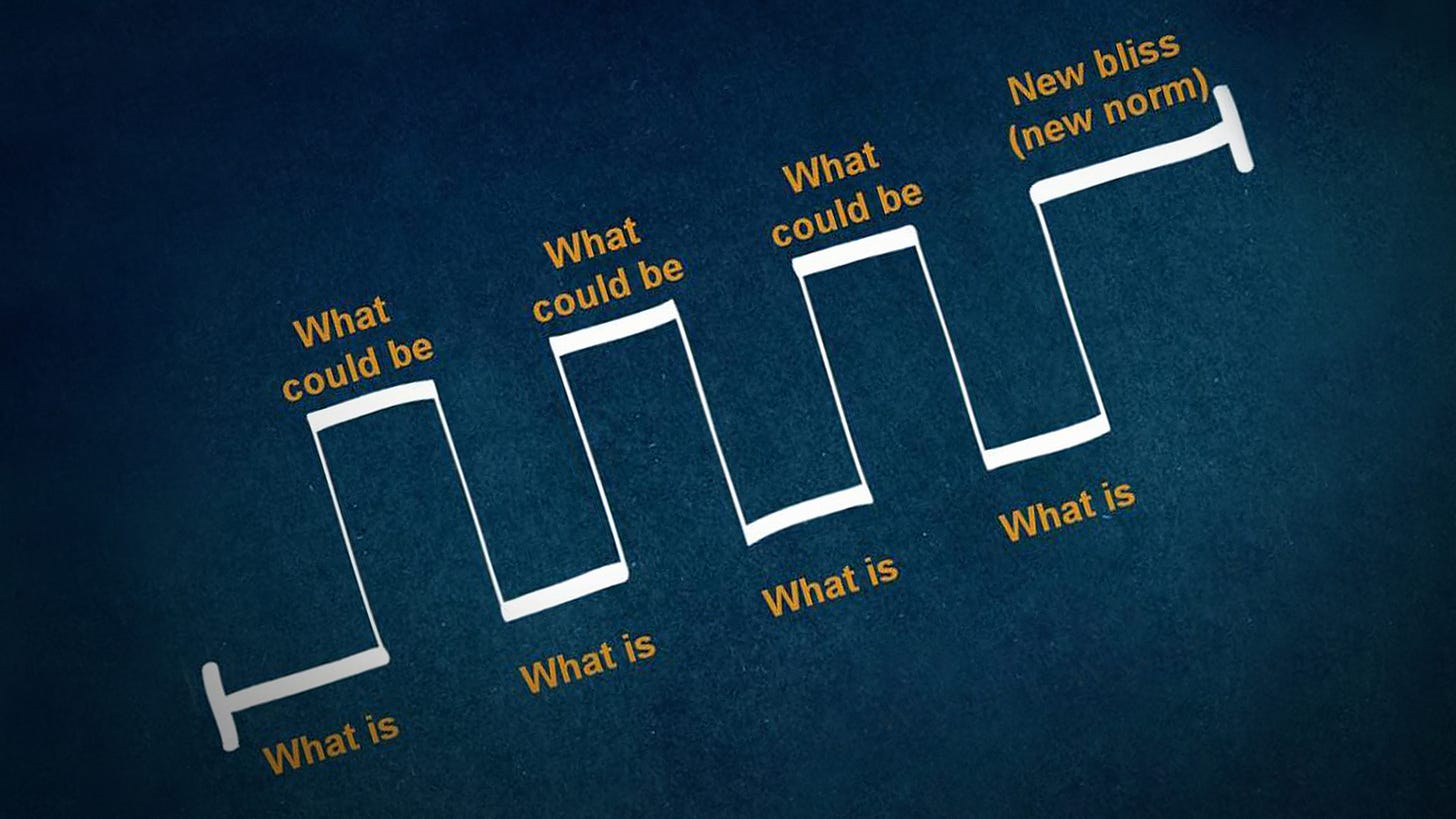
If this is not the first time you’re reading The Plot, you already know that I’m a big fan of great public speaking. I also love bringing rhetorical devices and techniques into my data work, so here is one for story structure. Presentation designer and author Nancy Duarte analysed a ton of historic speeches and extracted a very interesting flow common to many of them. In this structure, you alternate between the reality and a desired future (learn more in Nancy’s TEDx talk). This framework is super flexible — you can include as many status quo vs. desired change iterations as you’d like.

Learn from films
Pixar Animation Studios needs no introduction. They’re certainly known as some of the best storytellers in the world — just ask your kids! In a storytelling course on Khan Academy, their creative team reveals the three-act story structure they always use. Act one is for setting the stage, introducing the hero and their status quo. In the second act, something happens and the hero’s life is thrown into turmoil. In the third and final act, things start to unravel as a solution is found. Simple, yet engaging, isn’t it? When you’re creating longer data stories, this framework could be a solid way to go.

What are your favourite story structure frameworks that I haven’t mentioned? Let us know in the comments!
And thanks for reading The Plot!
See you in two weeks,
Evelina
*Border Hacker is a book by Levi Wonk and Alex Kirschner that tells the story of a man who will do anything to return to his family, and the friend who will do anything to help him—and a deeper parable about the violence of US immigration policy as shot through a single, extraordinary life. Get your copy here.


