
Heartbreaking data storytelling
The behind-the-scenes of a data narrative on one of the most common fetal anomalies

Every data story has a human experience behind it. Some of those stories are told loud and clear, while others are silent. This is why we’ve just launched Parabole Originals—a series of data narratives on topics that matter but rarely get funding or attention. The first edition, published last week, is very close to home for me.
It tells the story of spina bifida—a severe malformation of a spine that leads to life-long disabilities. My husband and I found out that our first baby had this condition last June, halfway through my pregnancy. What followed was heartbreak and a termination.
That, however, is not the point of the story. The point is that thousands of expecting parents face this diagnosis every year. Yet before it knocked on my door, I had never heard of spina bifida. So, our team decided to change that in the best way we know how: through data storytelling.
We wrote and designed a data narrative about spina bifida: how it happens, what it means and what can be done to reduce the risk. In this edition of The Plot, I’ll give you a glimpse behind the scenes into some of the decisions we made to bring it to life.
Introducing gentle darkness
From the start, we knew the visual direction of the web page had to be dark. The subject is grim and there is no way around that. But we wanted a kind of darkness that still feels gentle, almost soothing, not sad or overwhelming. We looked at inspirational pieces from Reuters, National Geographic and Pentagram, to mention just a few.
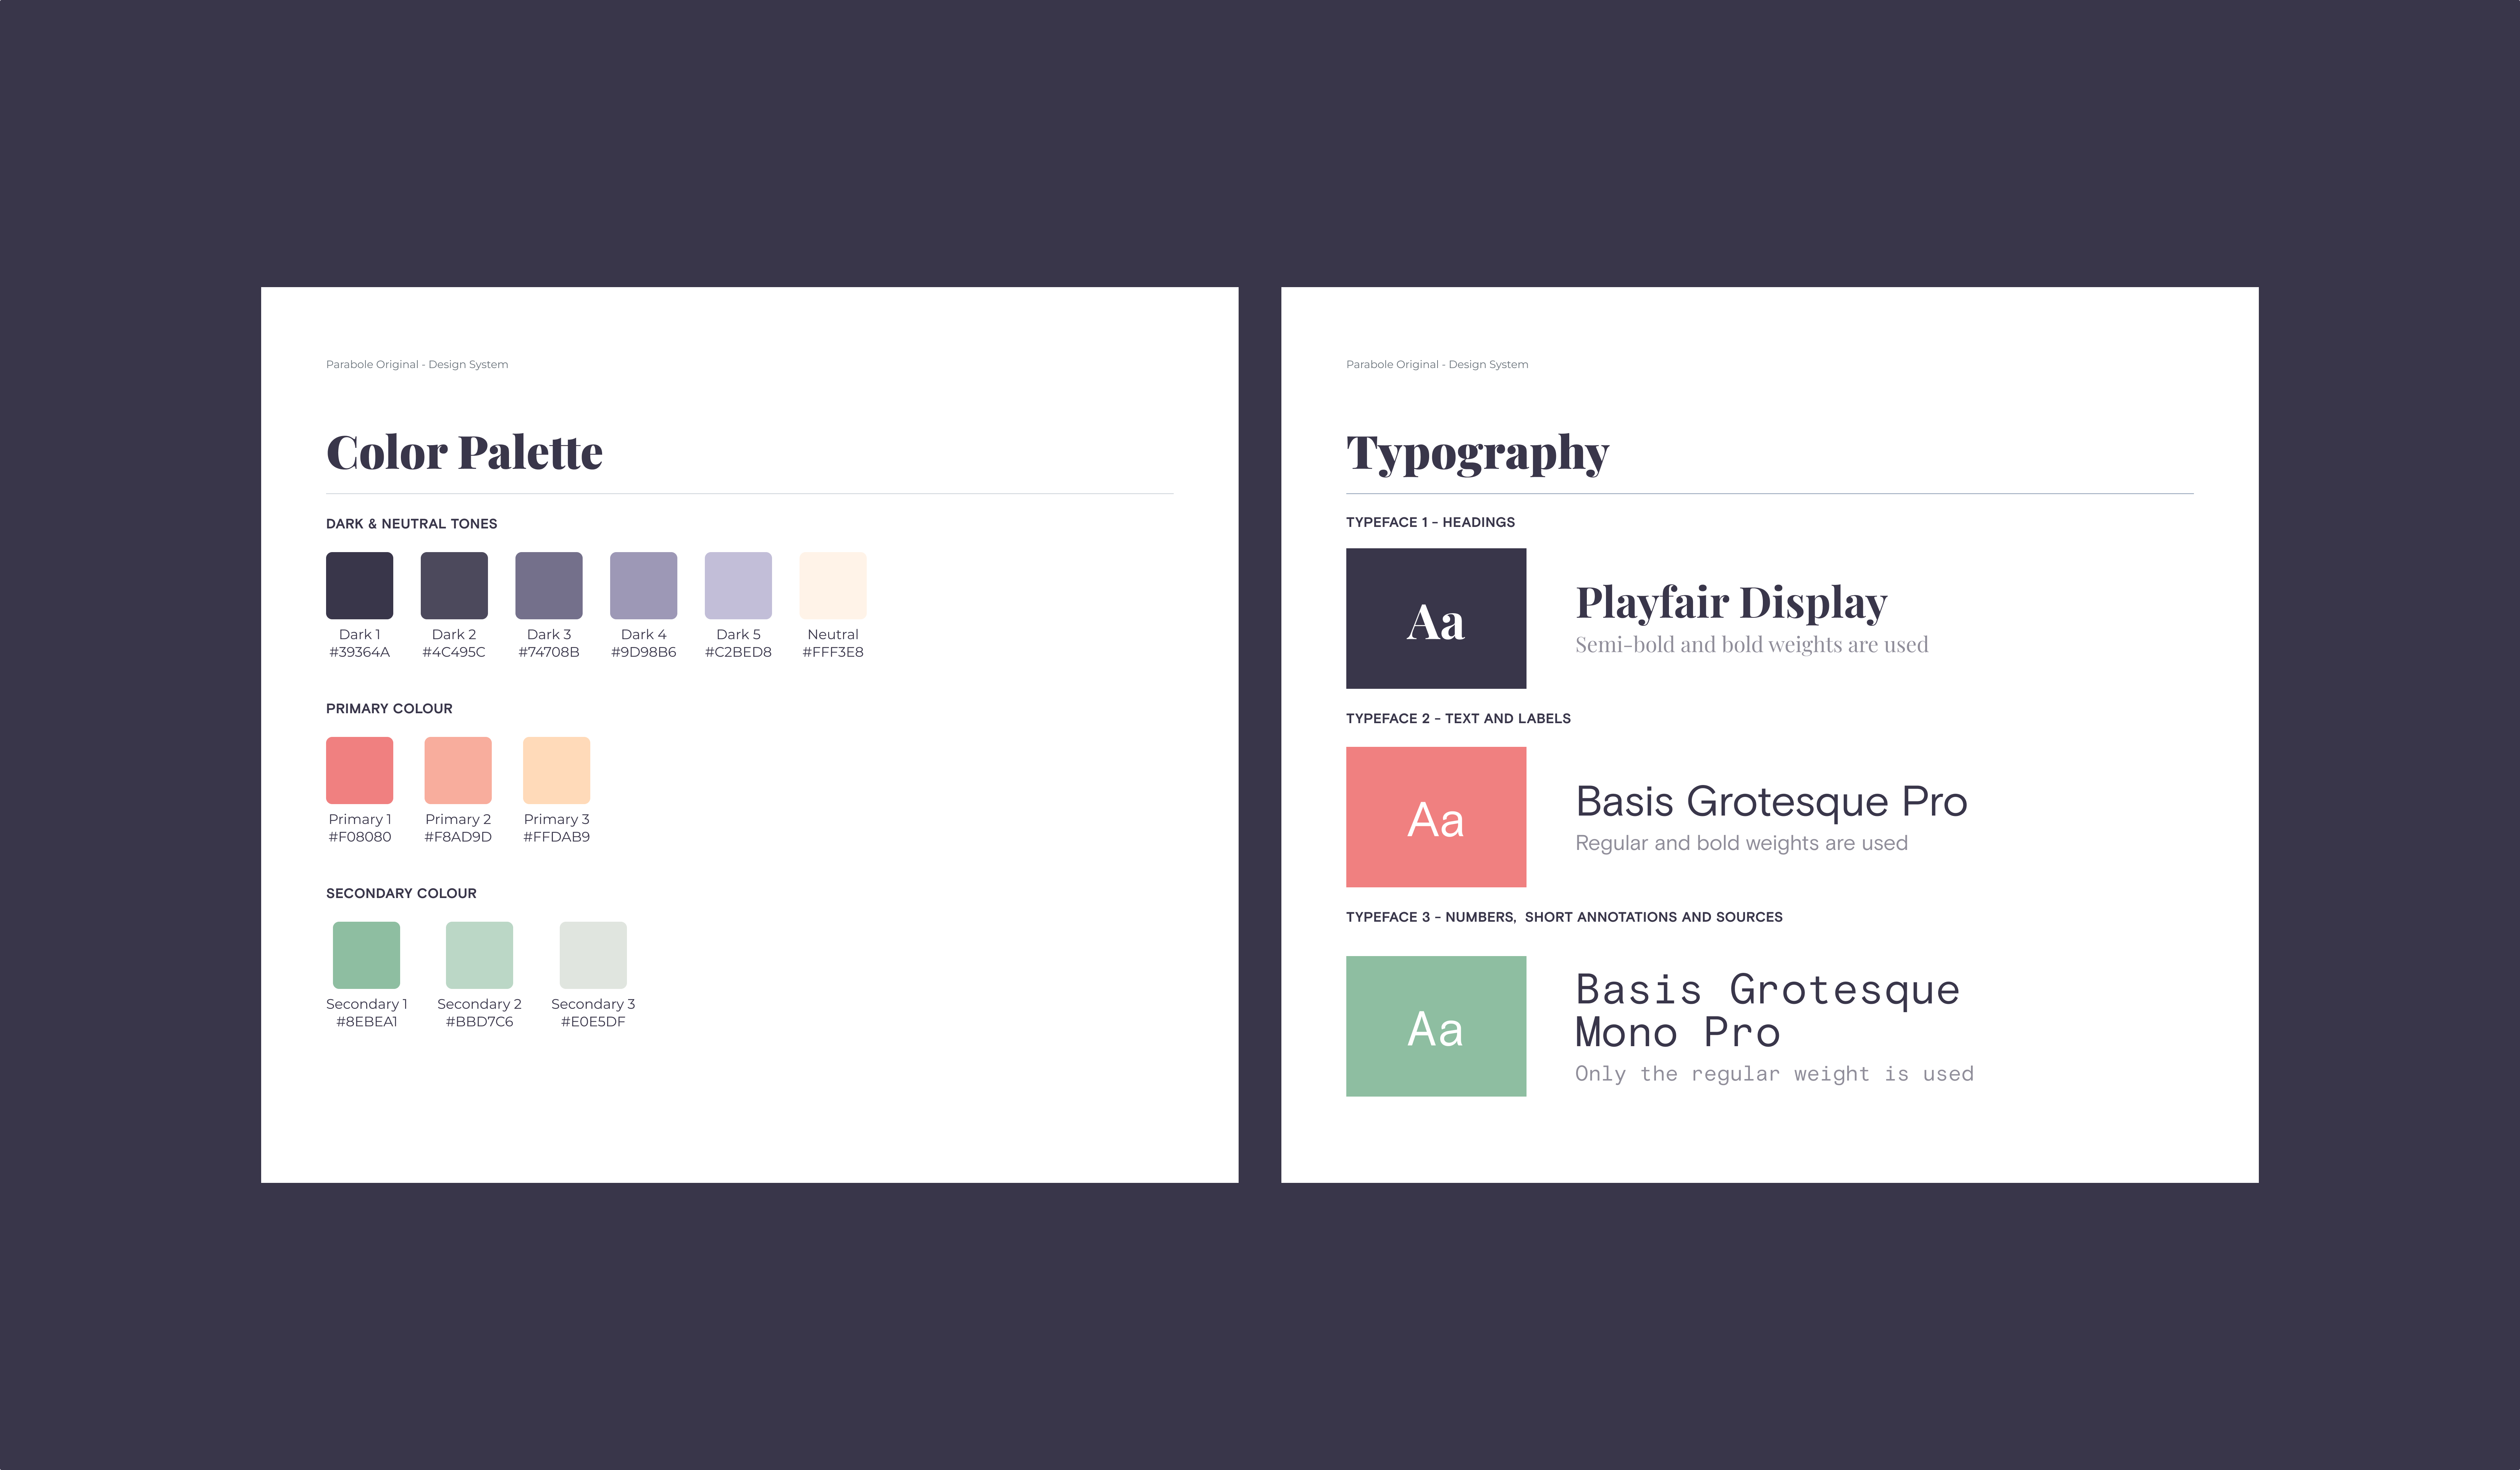
In the end, we chose a background that isn’t pure black, but deep and muted. Dark purples and neutral beiges became the backbone of the palette, with light greens and reds used to bring contrast and highlight key data and illustration elements.
Typography followed the same principle: a soft serif for titles, paired with a clean, modern grotesque for body text. We used a monospace cut of the same typeface for annotations and data labels as a way to give them more weight while maintaining the textual harmony.
The result is a creative direction that feels calm, almost tender, even as it tells a difficult story.
Keeping it real, but not too real
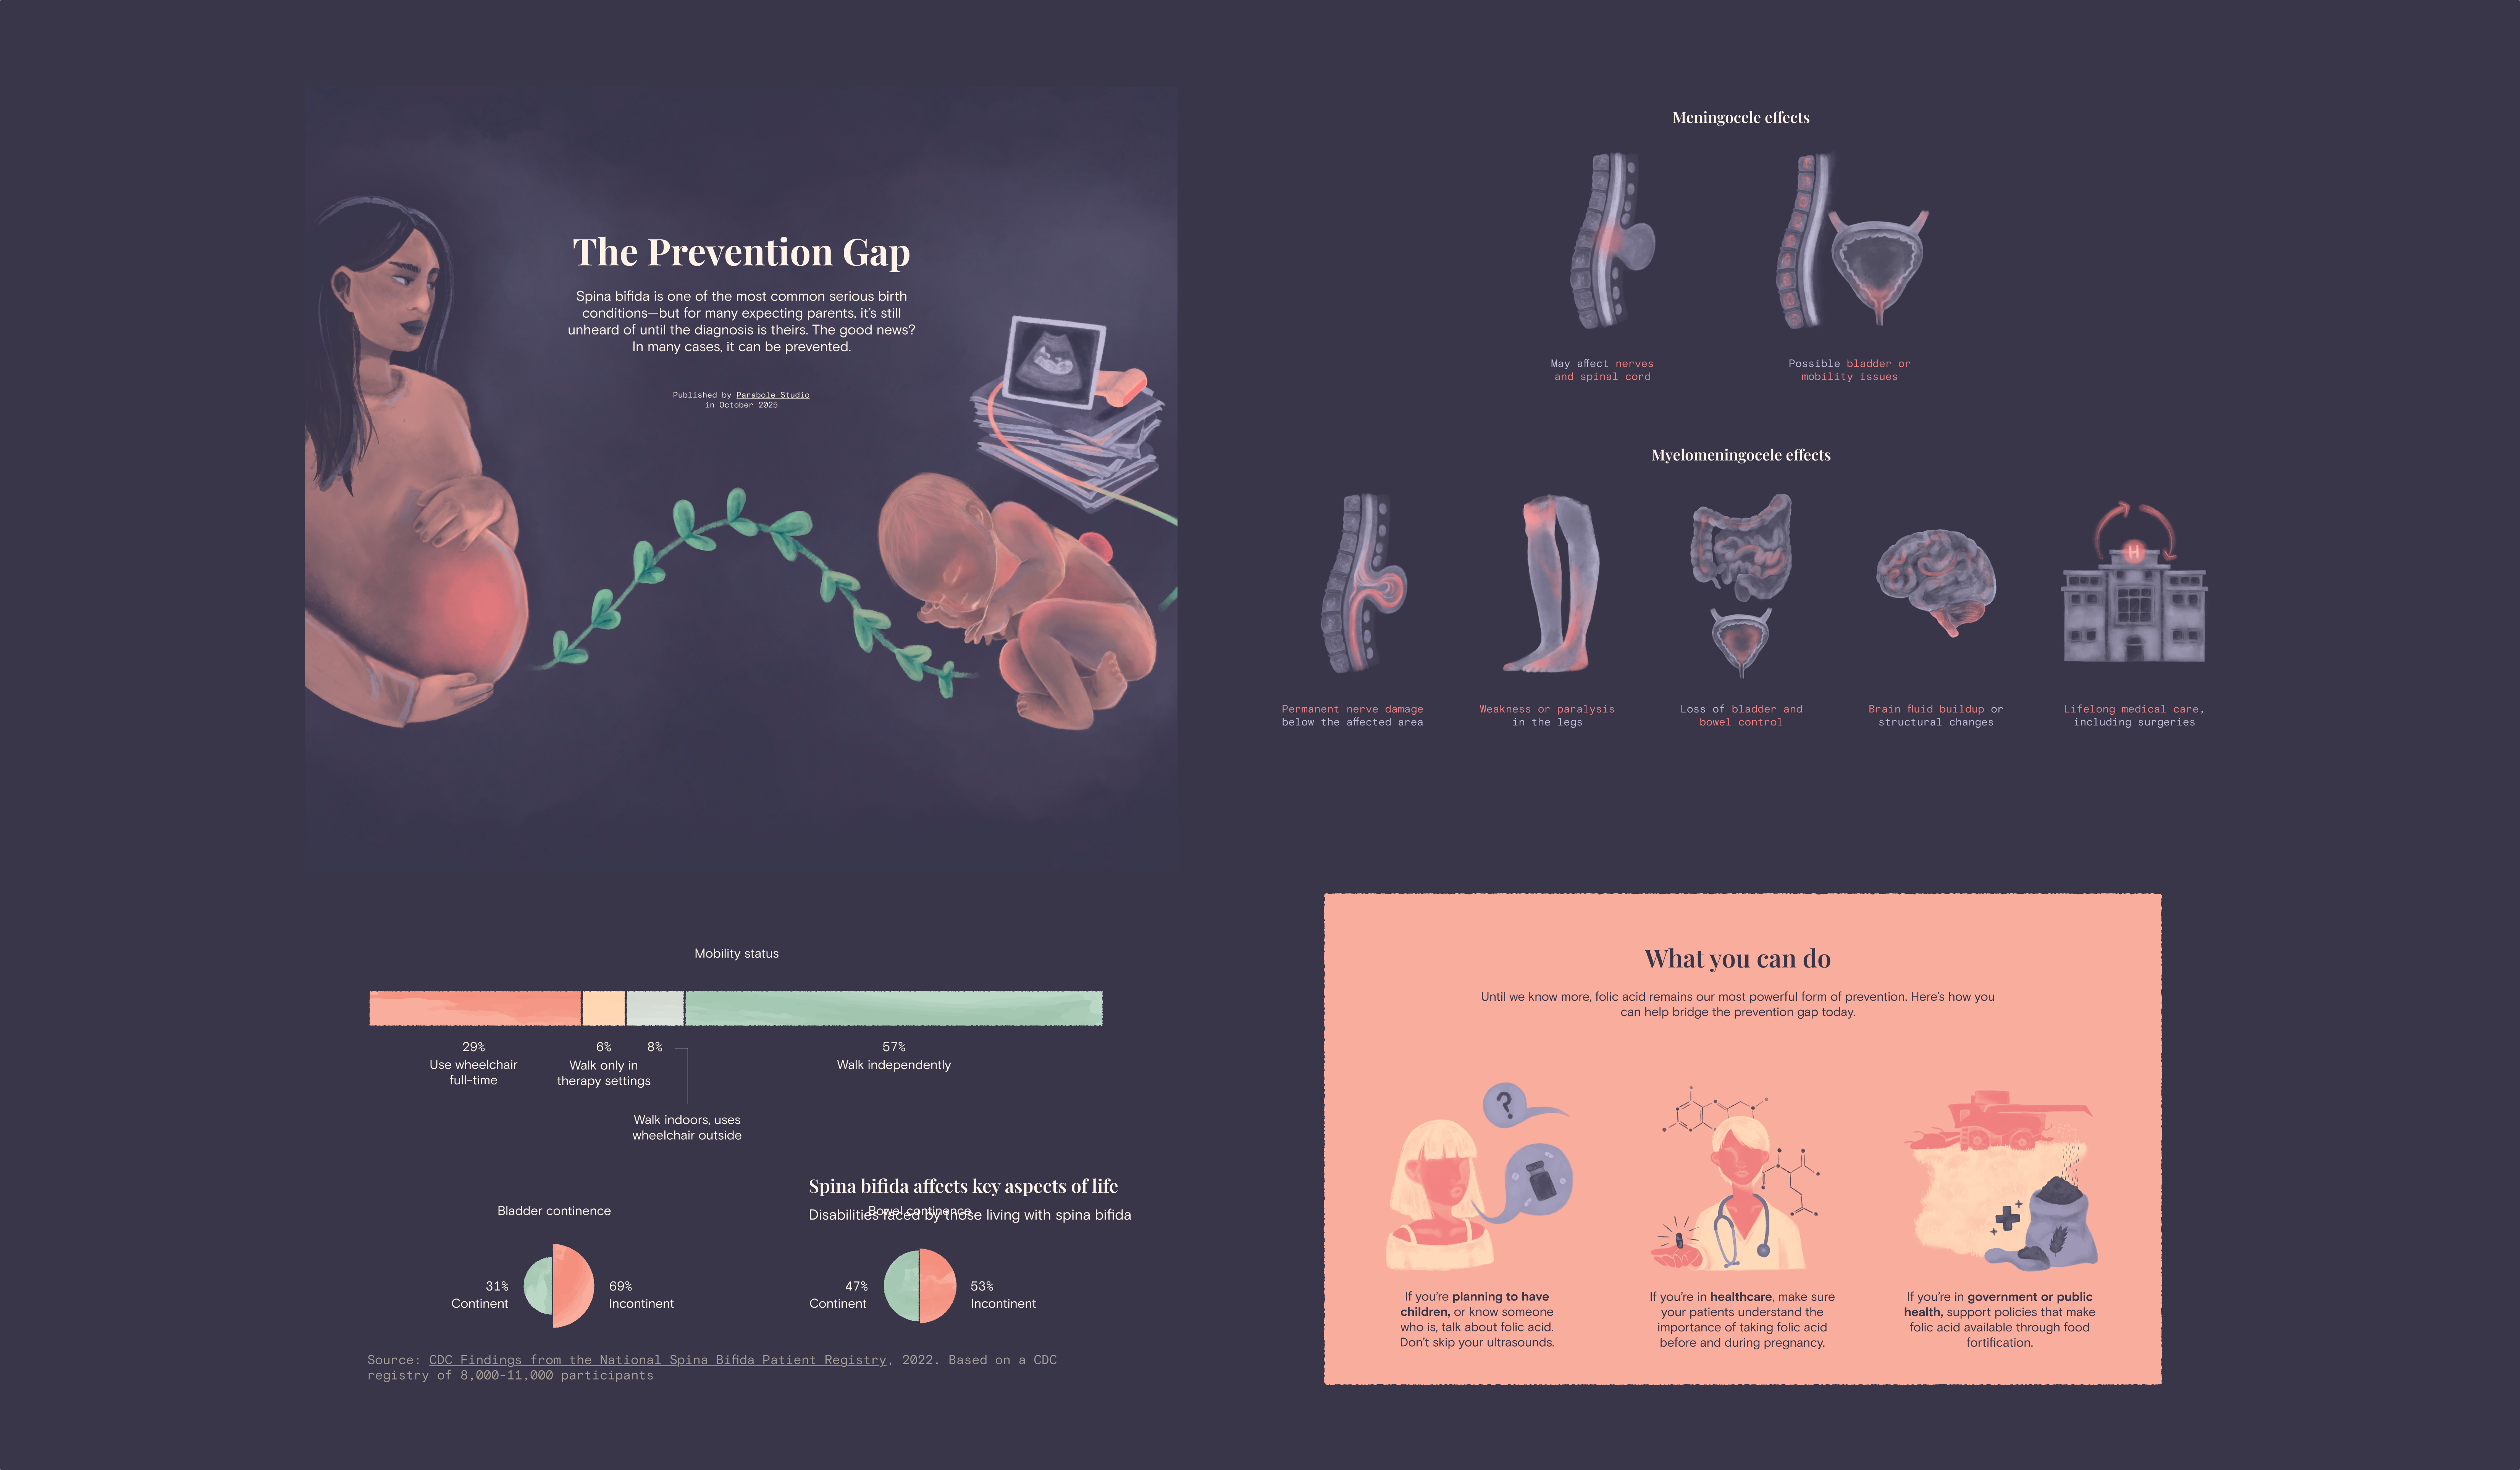
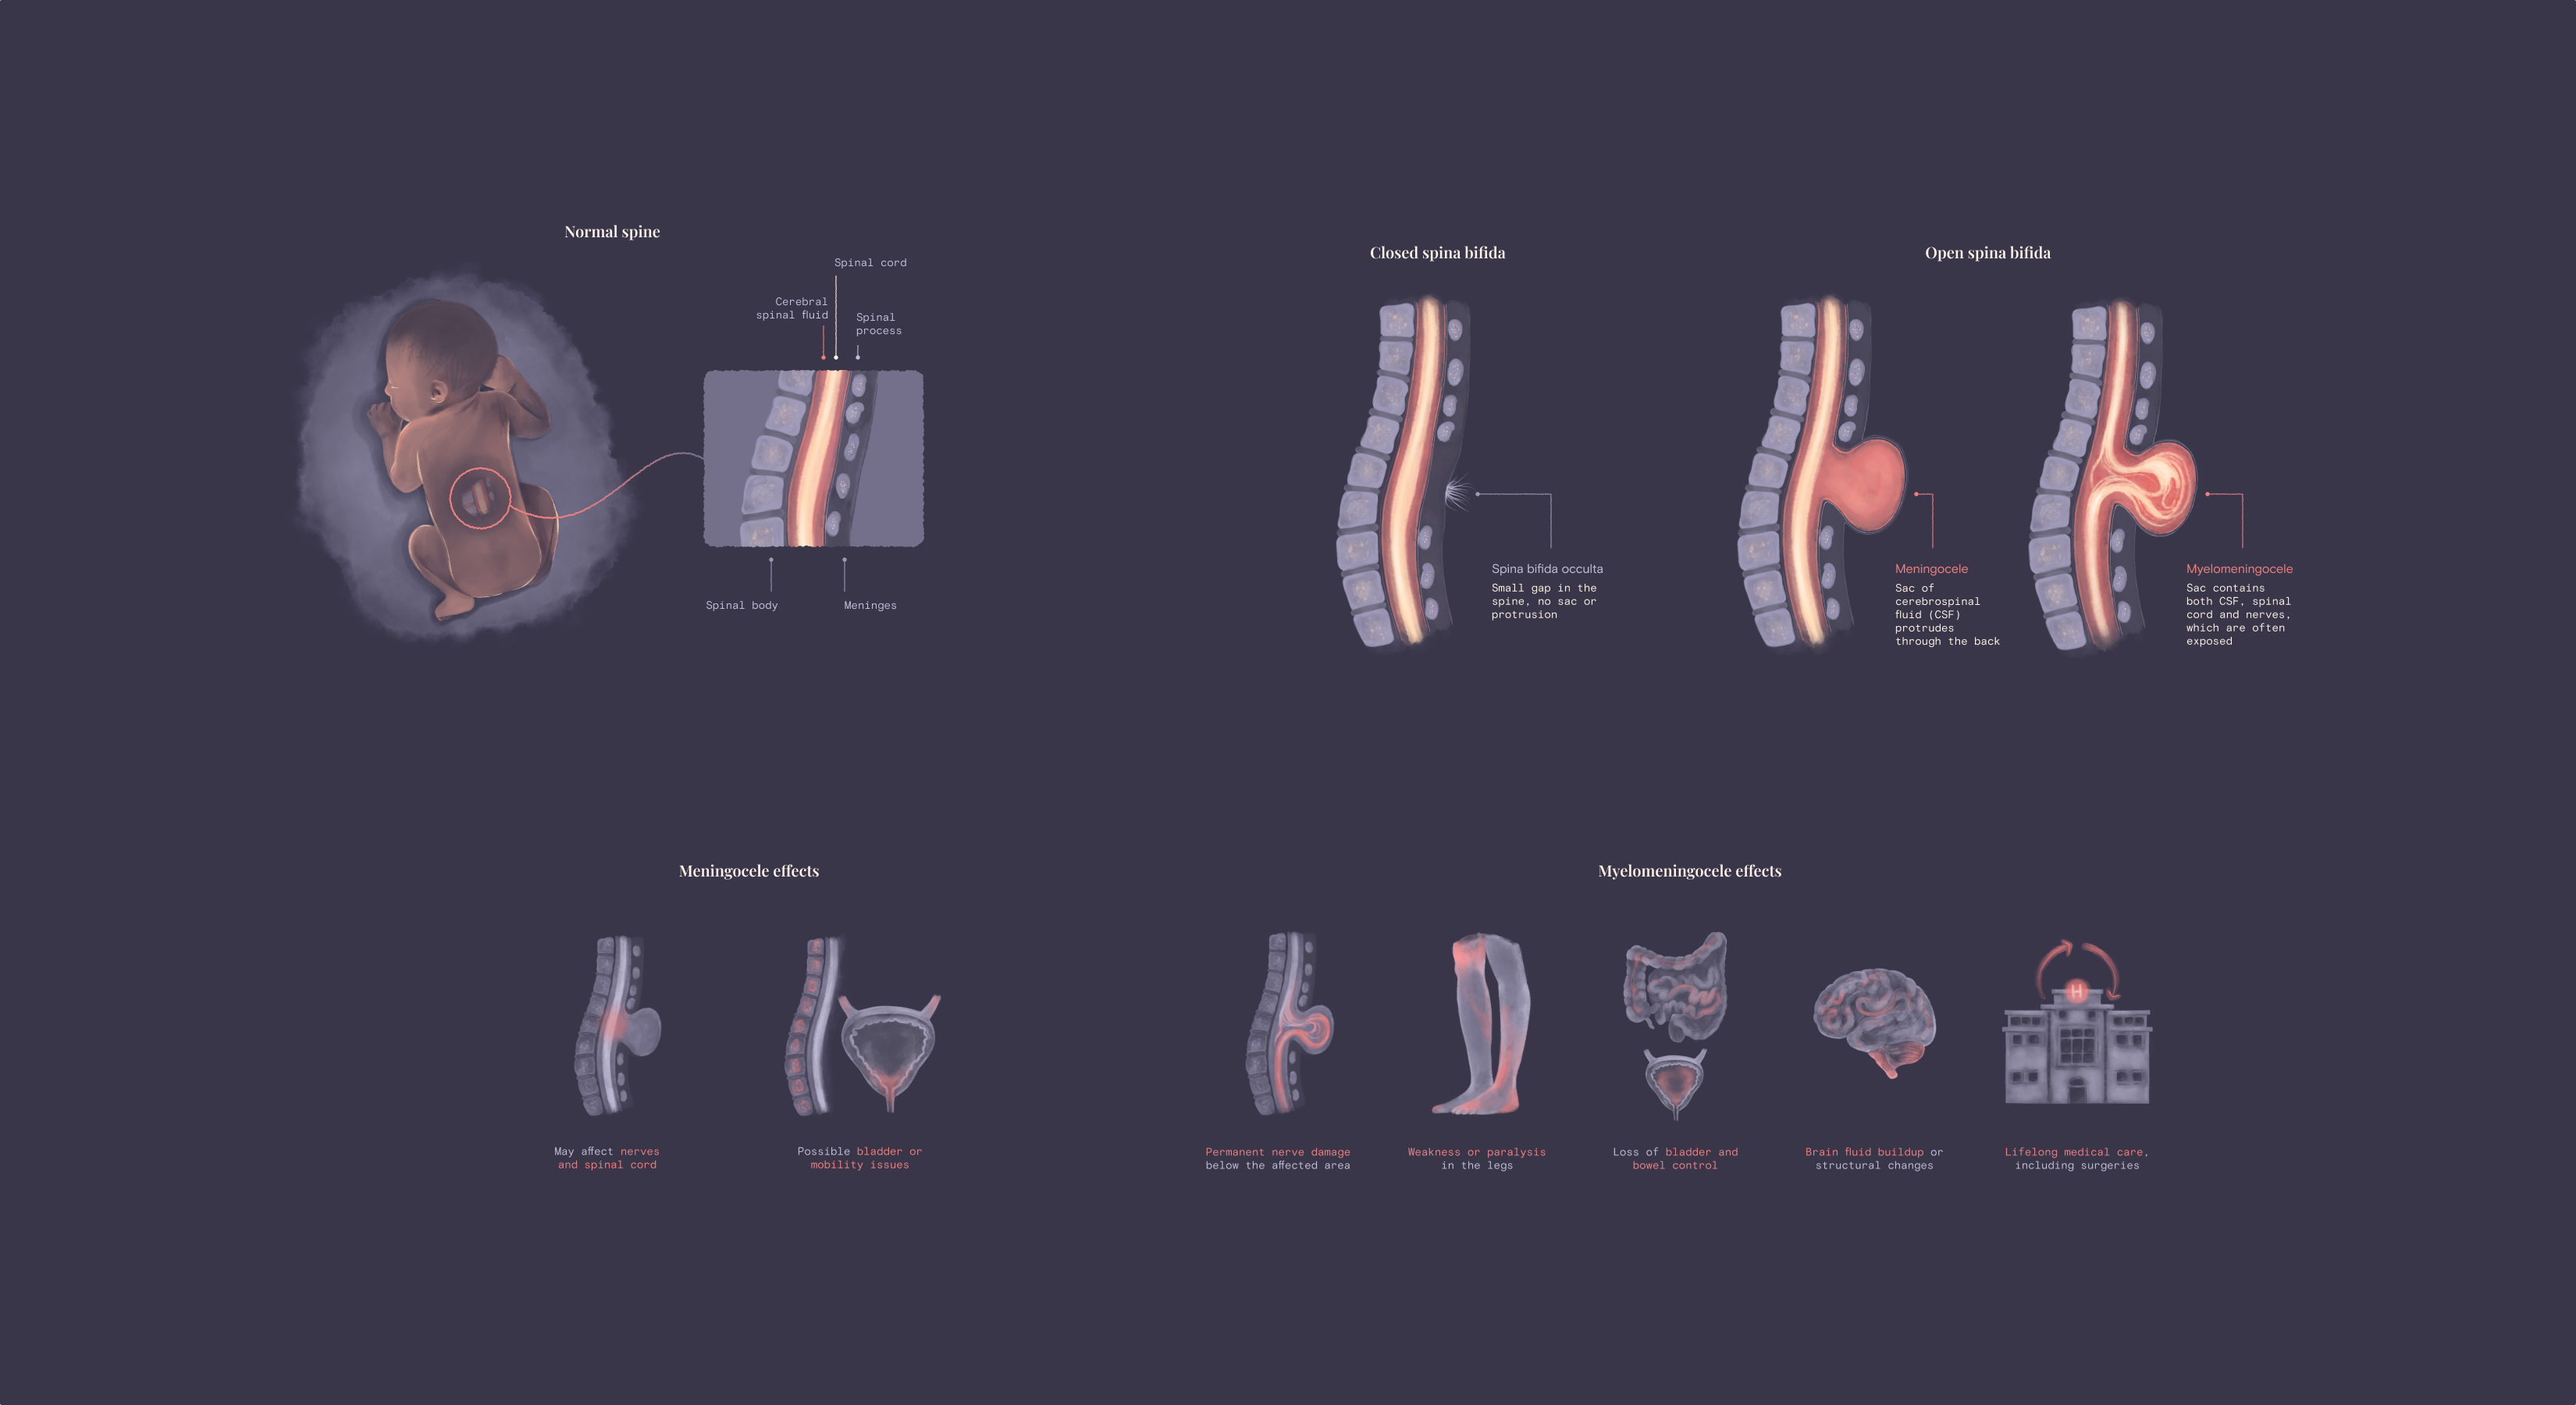
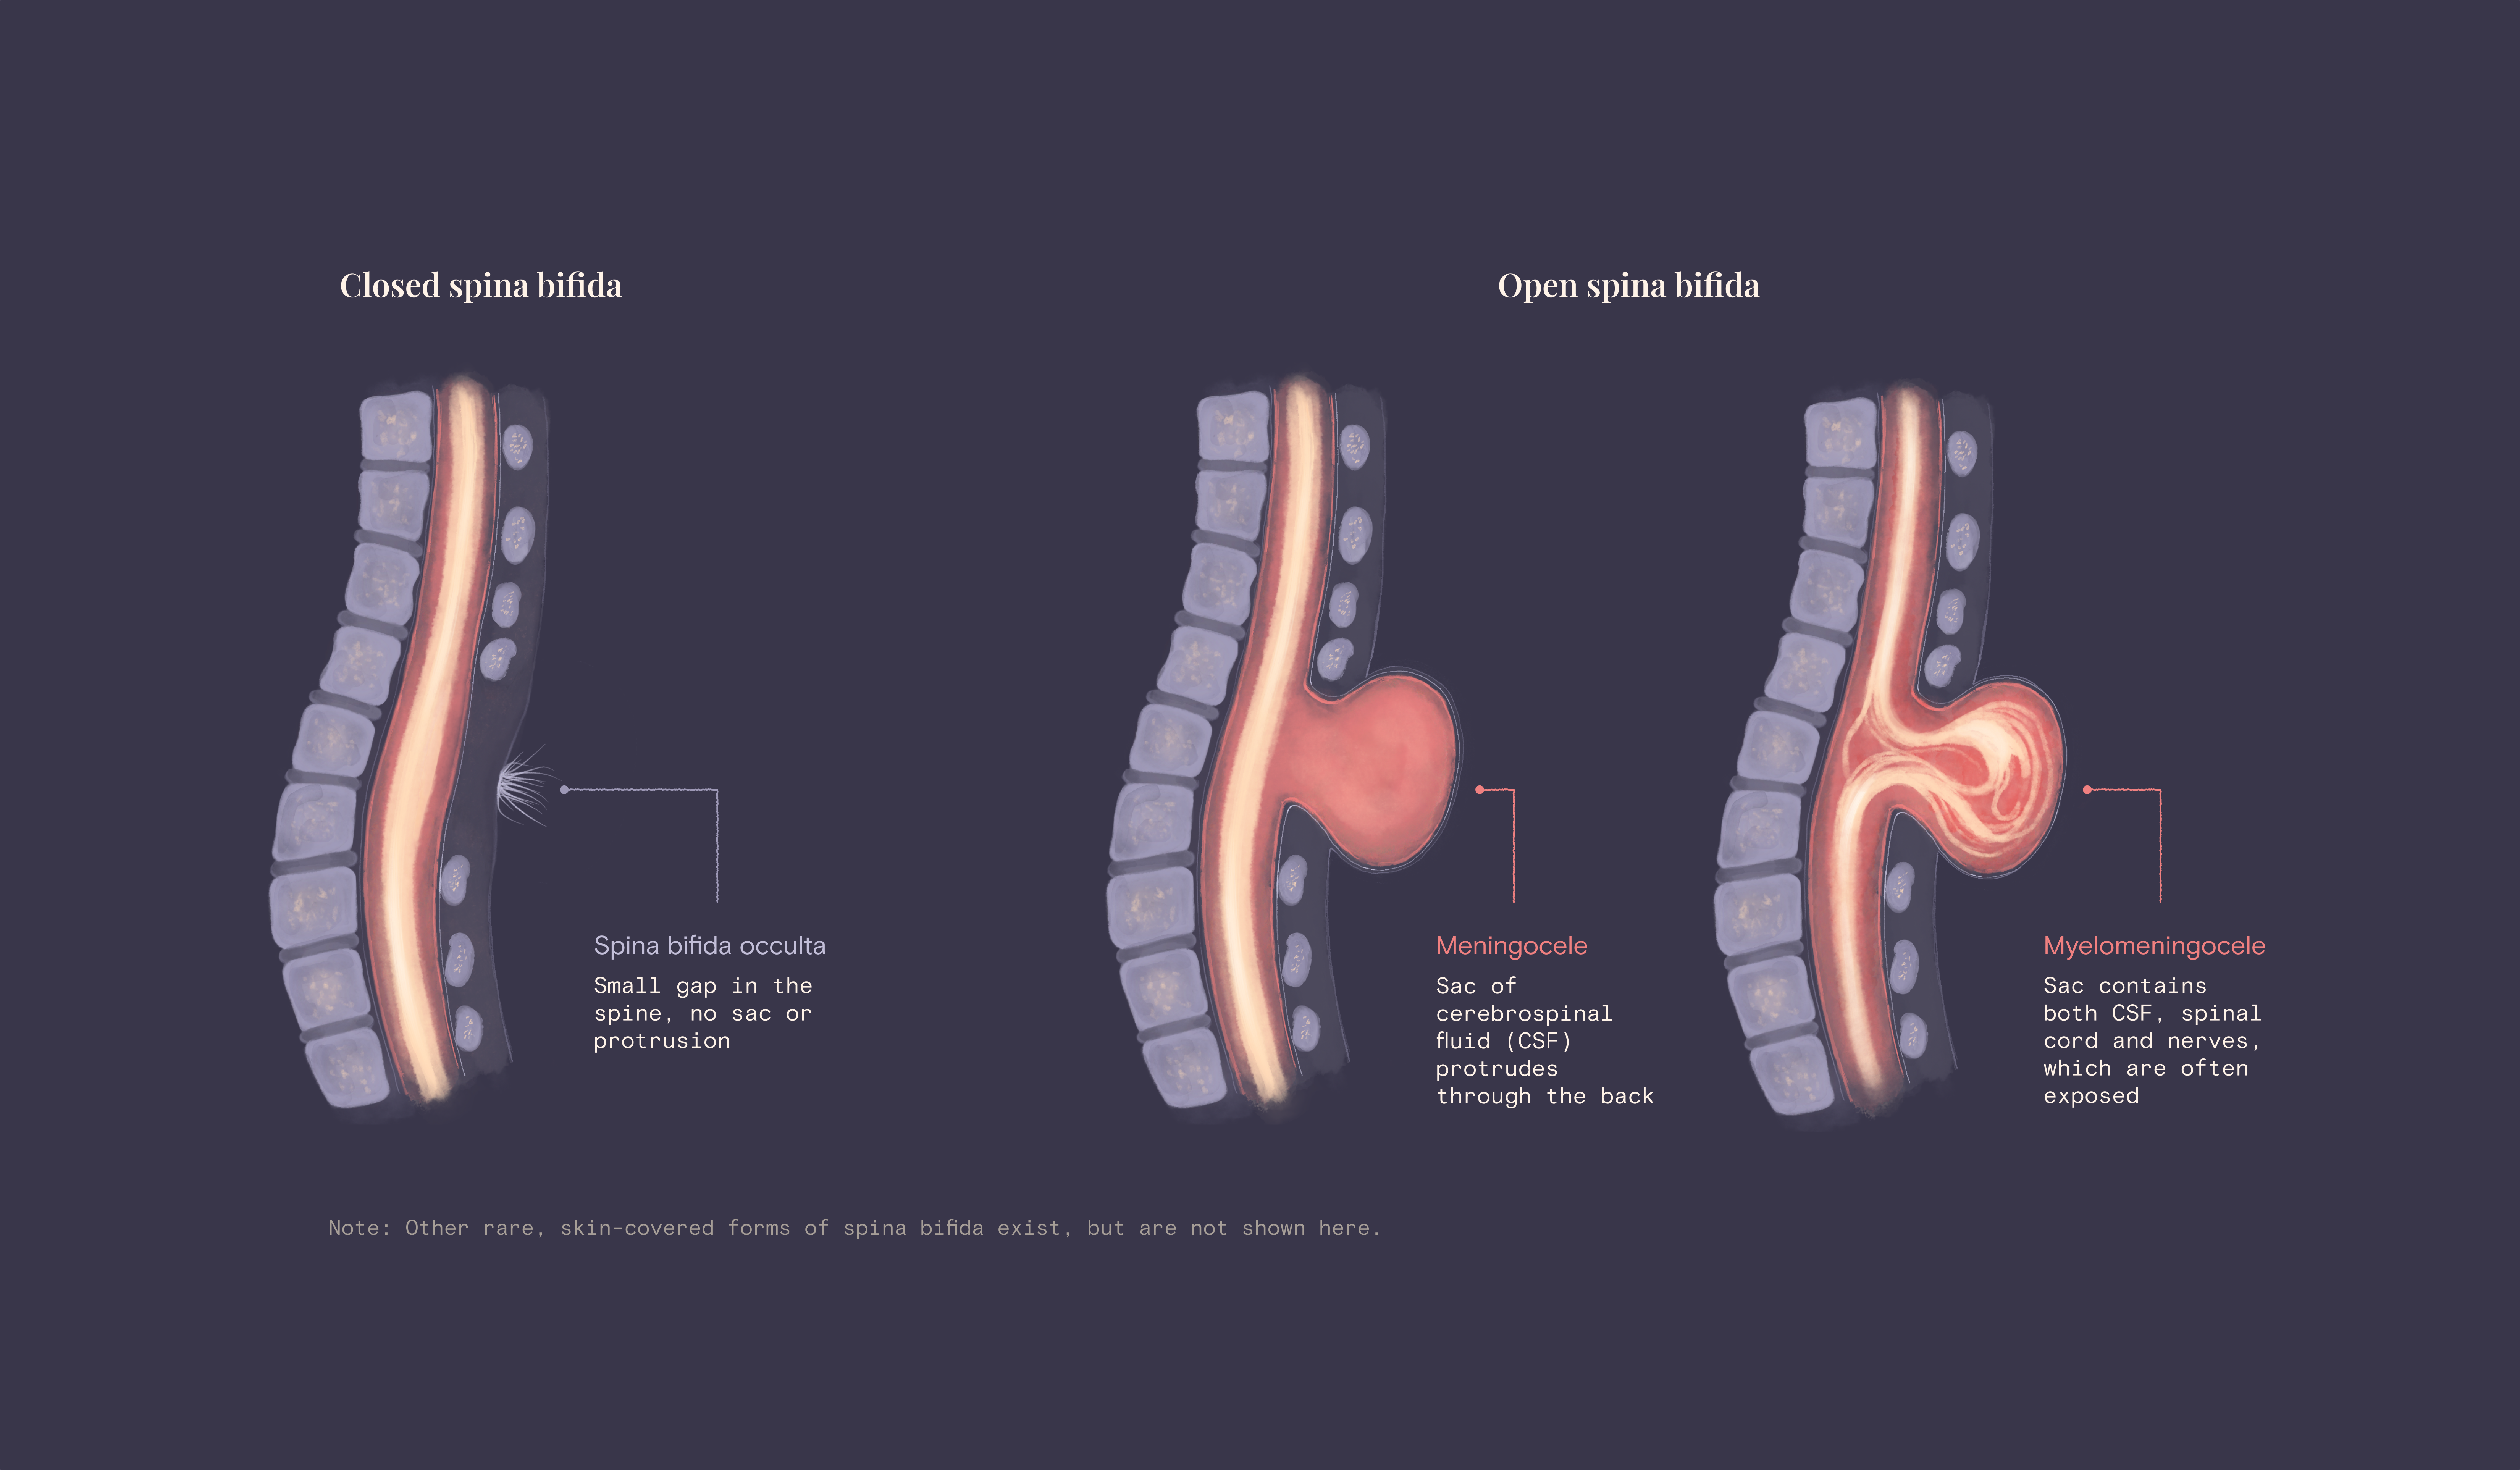
If you Google “spina bifida” (which I don’t recommend), you’ll find quite graphic images of newborns with exposed spines. Technically, they’re accurate, but are they helpful? Not that much. We wanted to inform, not give people nightmares. So instead, our designer Valeria Beccari created gentle, watercolour-style illustrations that explain the anomaly without shocking the reader.
Making the science accessible
Writing a narrative based on scientific research is always a trade off between precision and accessibility. For this story, we needed to make that call in multiple instances. First off, we focused on the three main spina bifida types—split into closed and open. Technically, we could have mentioned a couple of other types in between that are neither completely closed nor open. That would have added a level of precision to this chapter, but also brought confusion. So as the medical community considers the defect open if it’s not completely closed, we stuck with this simplified list.
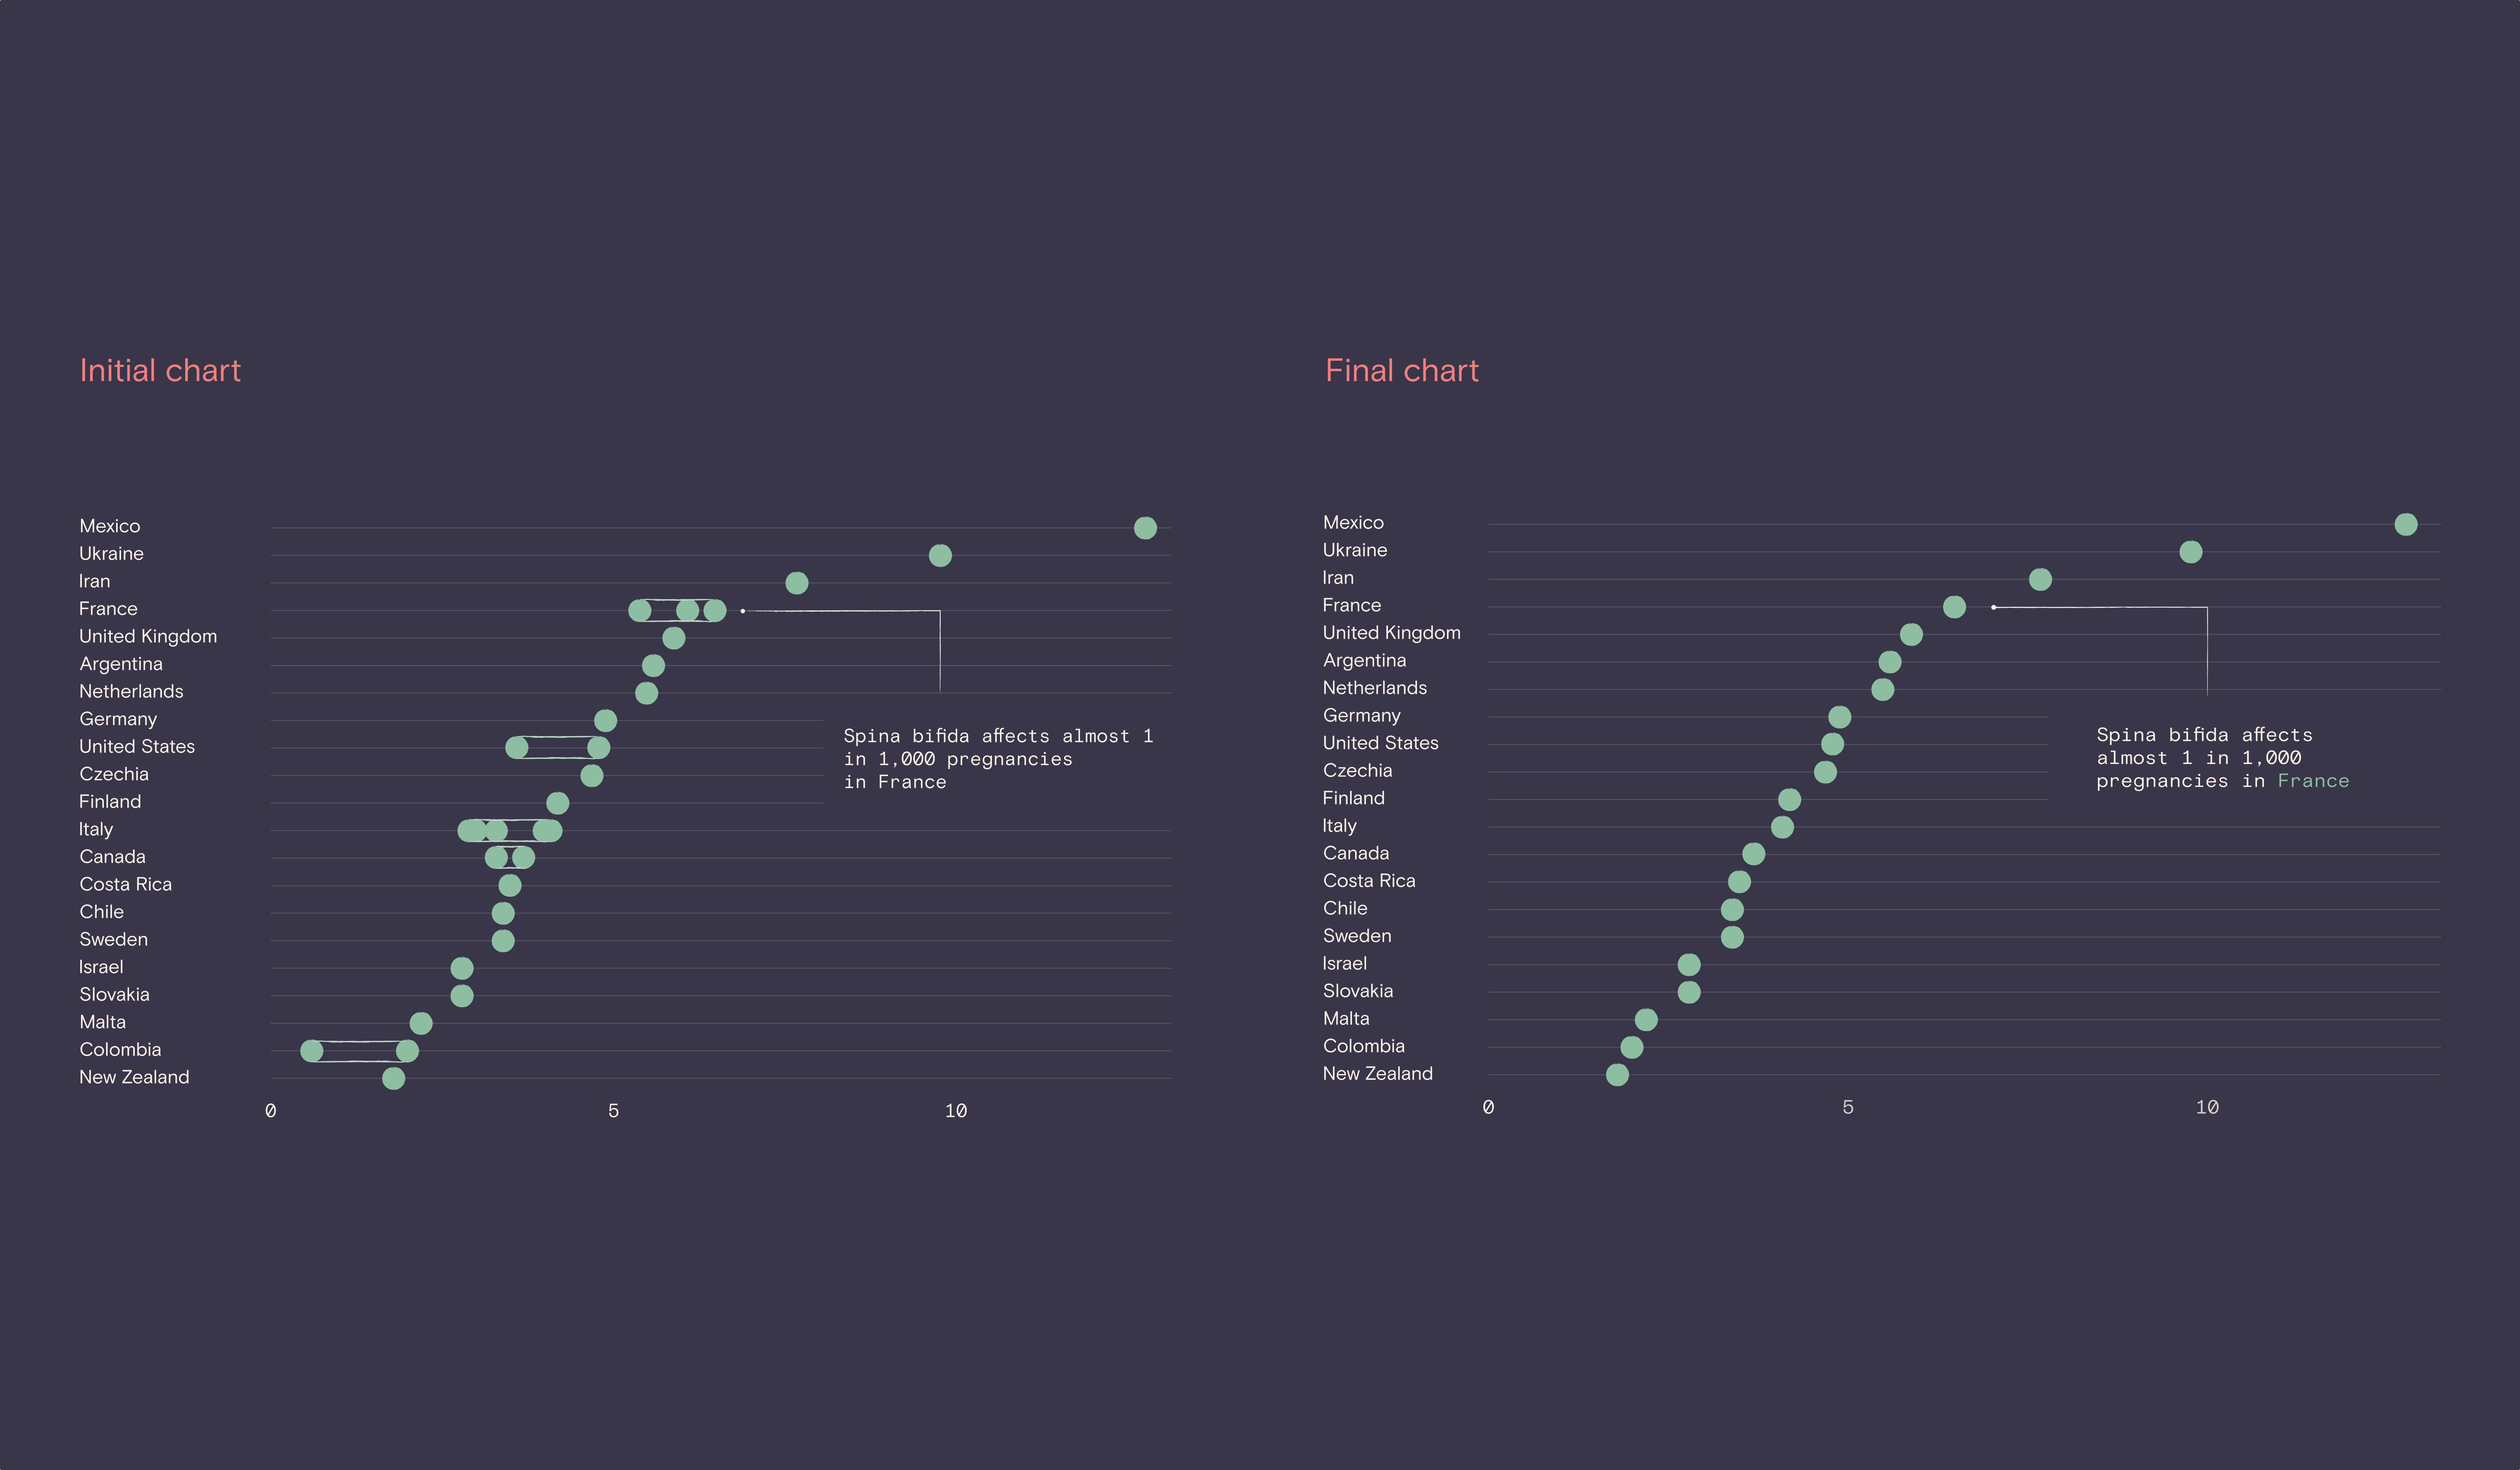
It took us quite some time to make the data accessible too. To give you an example, we had a long debate on how to show the prevalence rates of spina bifida. In the most recent, reliable reports, you may find 3-5 different figures for the same country. Not because some of them are more correct than others but because pregnancy outcomes are tracked in cohort studies that use different methodologies.
Initially, we wanted to show all these datapoints. But early reviewers (thanks, Jorge!) pointed out that the distribution was confusing rather than enlightening. So we simplified the graph by showing only the highest metric per country. Now, the reader can focus on the bigger picture: “how common is this in my country”?

This wasn’t an easy story to write but we’re quite proud of the result. The initial response to its launch was overwhelmingly positive and we hope it will act as a valuable resource for expecting parents and their families for a long time.
If you have ideas for the next Parabole Original—a data narrative on a topic that doesn’t get enough attention—let us know in the comments!
Thanks for getting personal with me,
—Evelina
This is so moving; thank you for sharing. I started subscribing to your newsletter as extra reading for my data apprenticeship about a year ago (I have now passed 🥳) but it has inspired me in more ways than I would have thought for a publication about data- It has made me see that the real power in data is how we can use it to share stories and that is a skill people in the humanities already possess. You are definitely making a difference with this work.
Thanks Evelina for this behind the scenes. And, of course, also a big hug for what happened to you and your family, and congrats for the piece. I was wondering: is the code available anywhere? I was curious to find out how the scrollytelling and the illustrations merged so well!