Behind the scenes of a rare dataviz exhibition
An interview with Marthe Viallet, the designer and organiser of some pretty unique data visualisation events.

Your design piece printed out and hung on a wall. Sounds like a dream, doesn’t it?
For many of us doing most of our work online, opportunities to see it printed can happen only once or twice in a lifetime. While art exhibitions are a common, dataviz-focused shows are still hard to come by. For the past two years, great visualisation exhibitions took place in Nantes, France. I interviewed one of the organisers of these exquisite events — Marthe Viallet — who was kind enough to share some of her thinking and trade secrets. Her interview below — enjoy!
Hi! Thanks so much for accepting to talk to the readers of The Plot. Could you start by telling us a little bit about yourself?
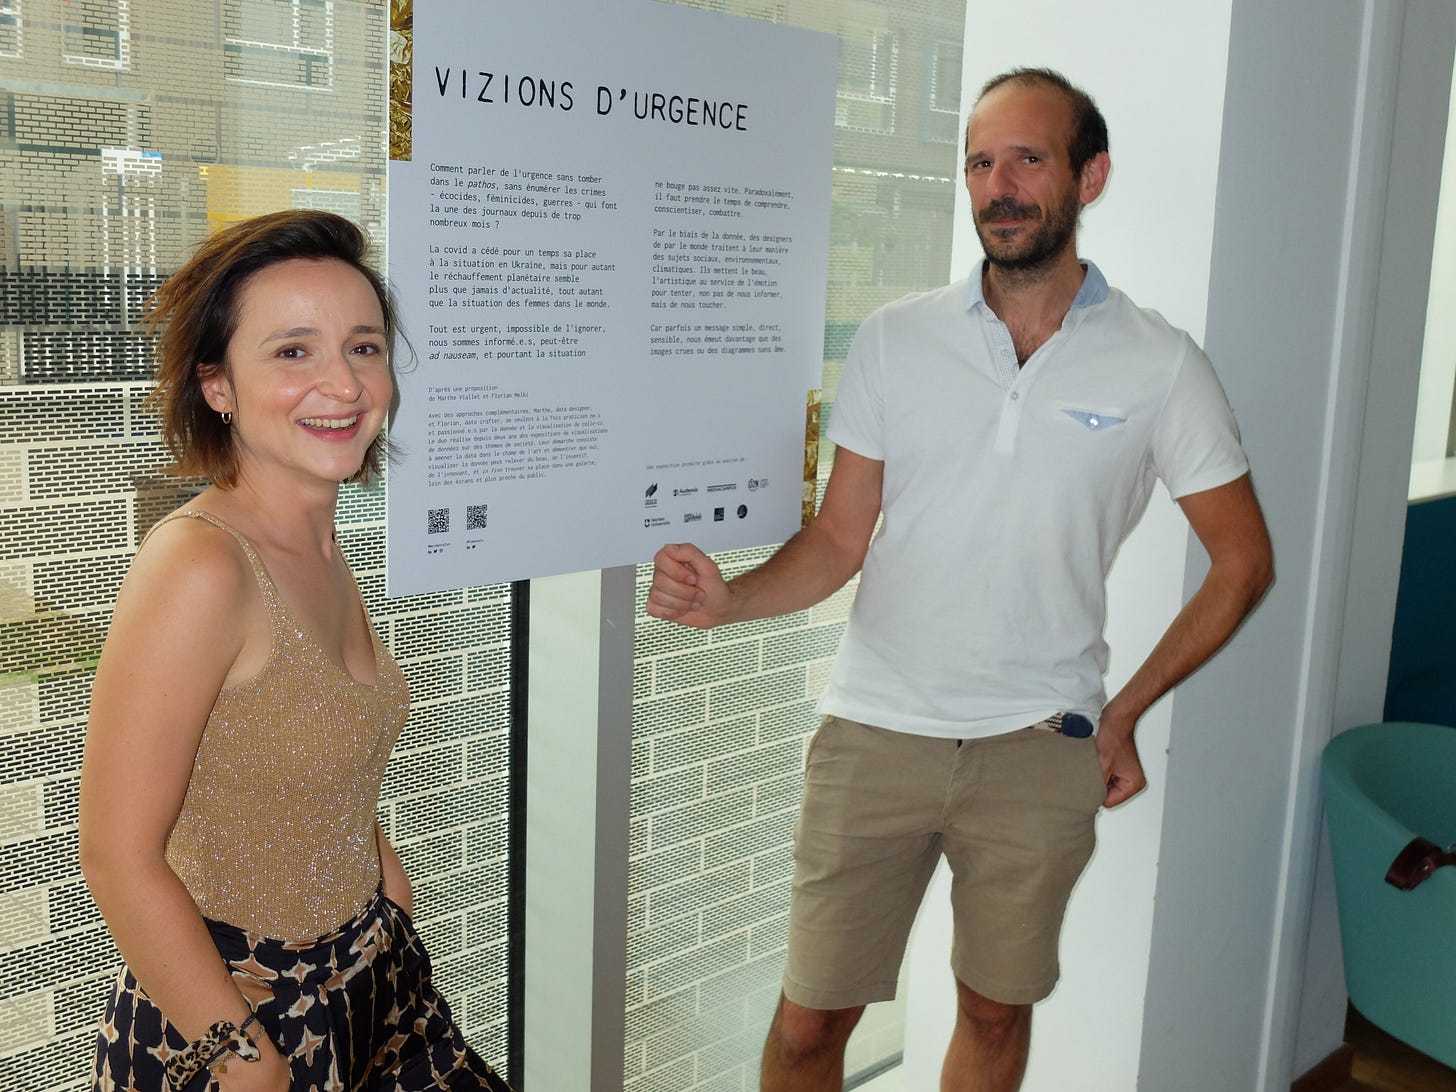
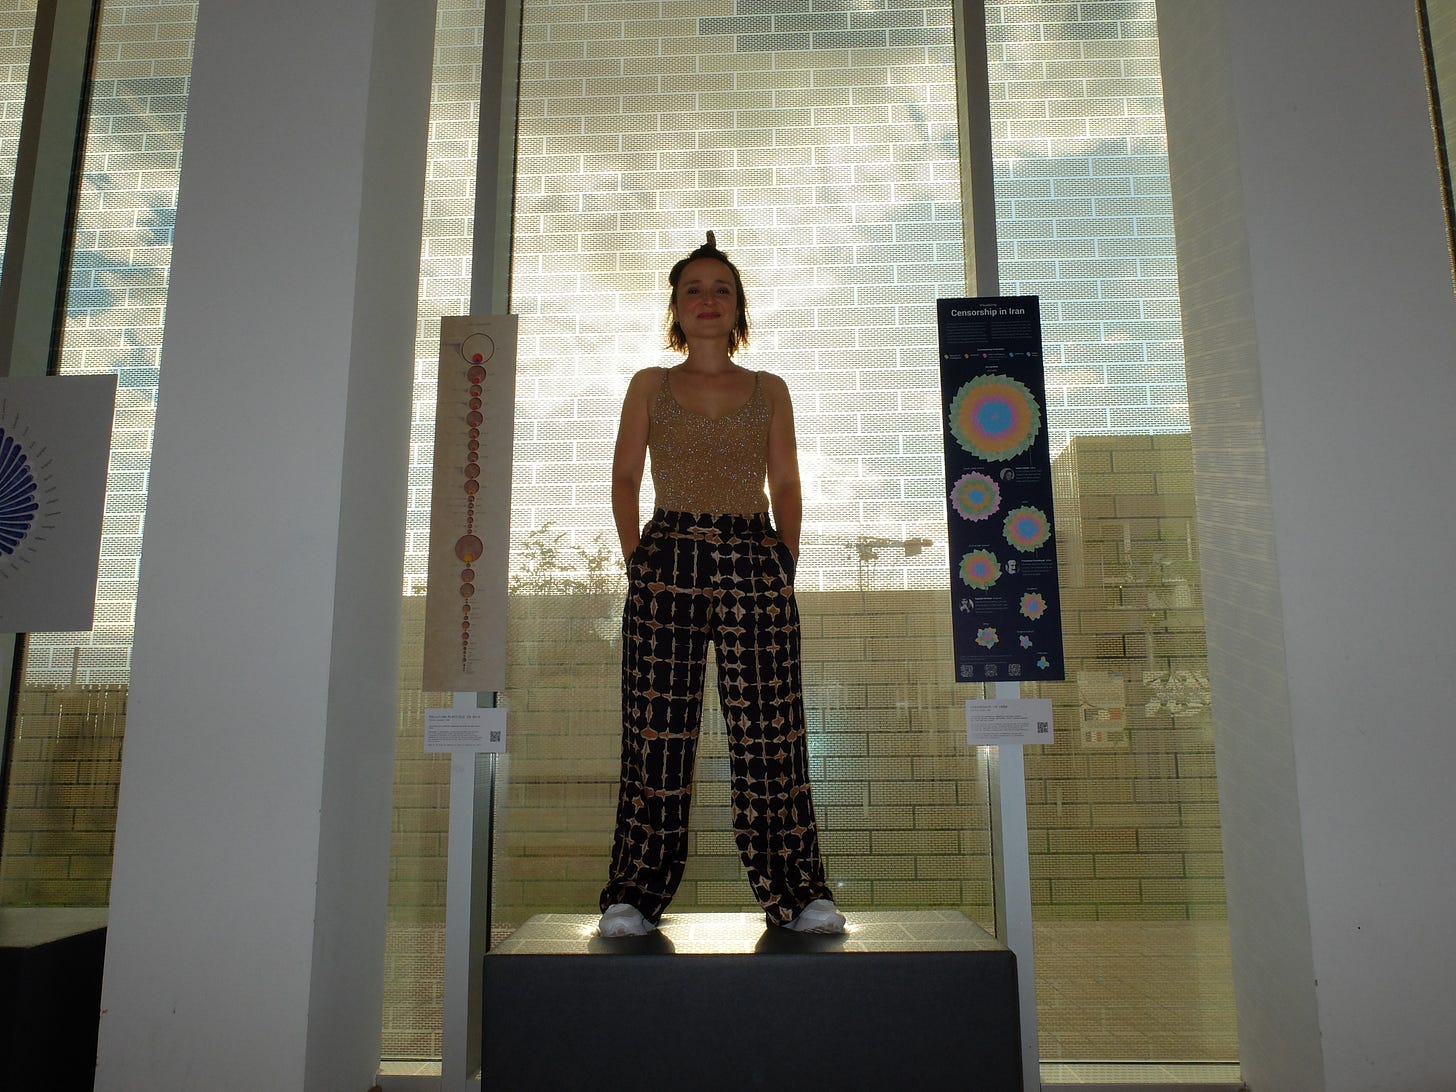
Hello! Thank you the invitation. I am Marthe Viallet, a 37 year old Parisian. I have a background in public finance law, but for the past three years I’ve been freelancing in the data-sphere. I spend most of my time organising data visualisation exhibitions, and also consult and give talks on data design.
You organised your first dataviz exhibition last year. Where did the idea come from and what motivated you to run with it?
I’ve always been passionate about culture and museums. So when I started working in data visualisation, I made a mind-map of my dreams and one of them was the design of a data visualisation exhibition. During the first lockdown in 2021, I met Florian Melki, a data analyst who is very active in the Nantes city data ecosystem. He suggested we put together an exhibition as part of Nantes Digital Week, so of course I had to go ahead with this crazy idea!
At the time, there were many reasons that motivated us to organise an in-person dataviz event:
Museums were developing digital versions of their showcases due to the Covid-19 pandemic, so it was fun to go against the grain.
We wanted to get dataviz out of tiny phone screens. Some visualisations deserve a larger format and more attention than a quick glance on a social network's news feed.
We were attracted by the idea of democratising data visualisation, making it accessible to the general public. We seek to showcase original pieces that reconcile data and art, and build a narrative around the subject.
This is how our first exhibition — Dots, lines and people — came to life.

What motivated you to organise such an event for the second time in 2022?
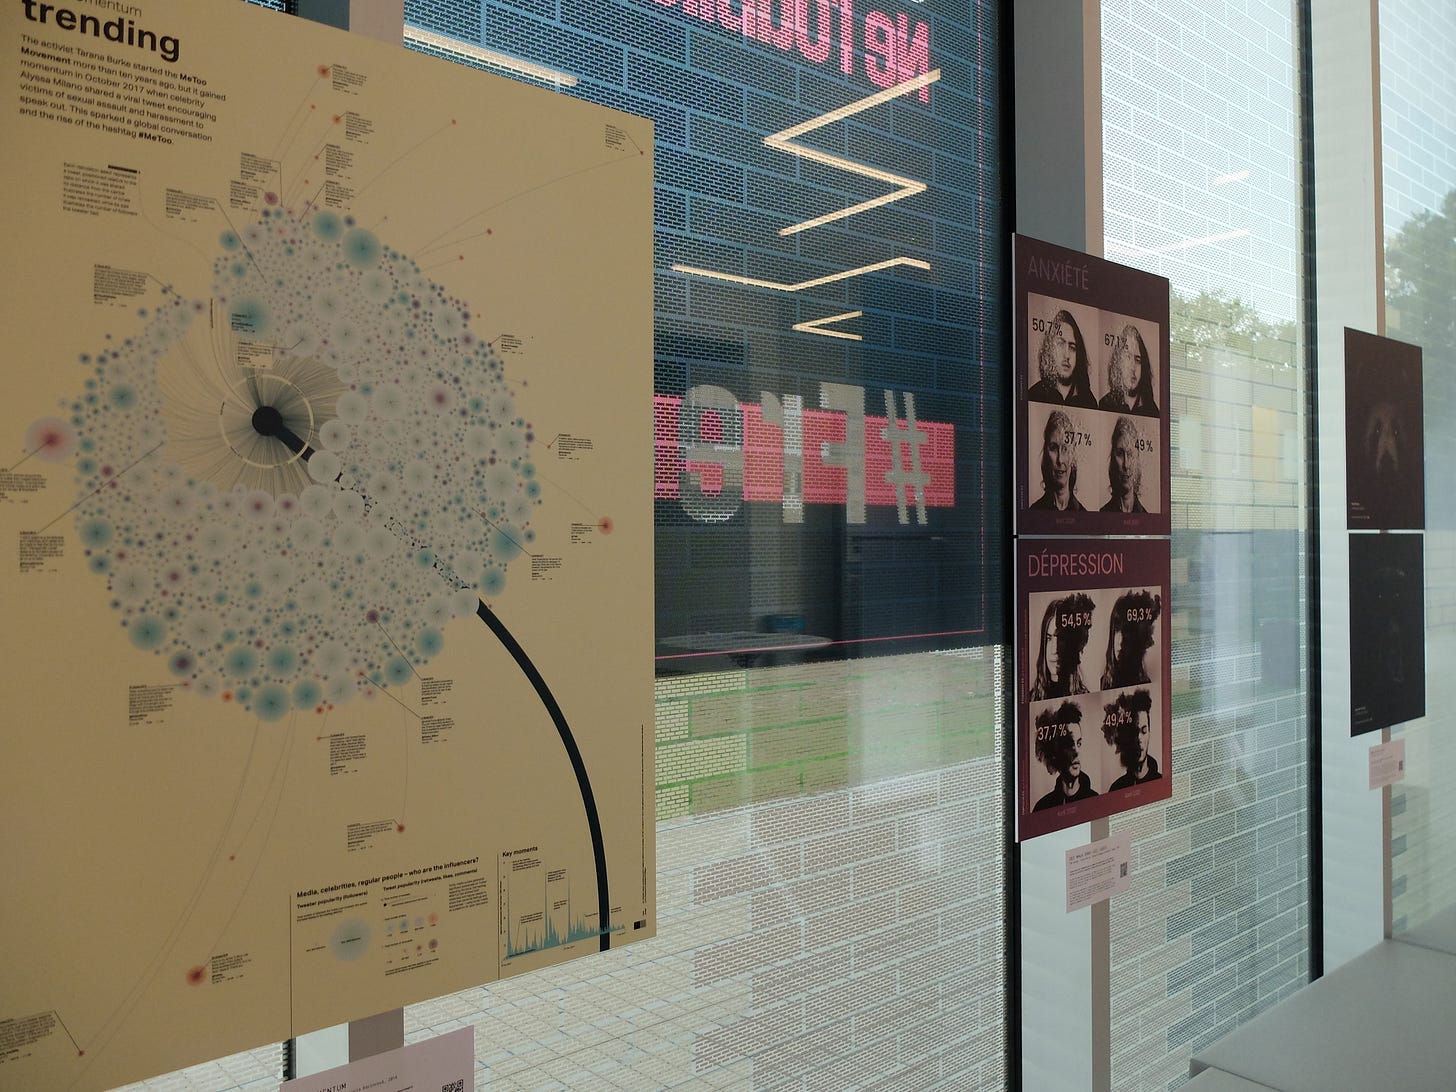
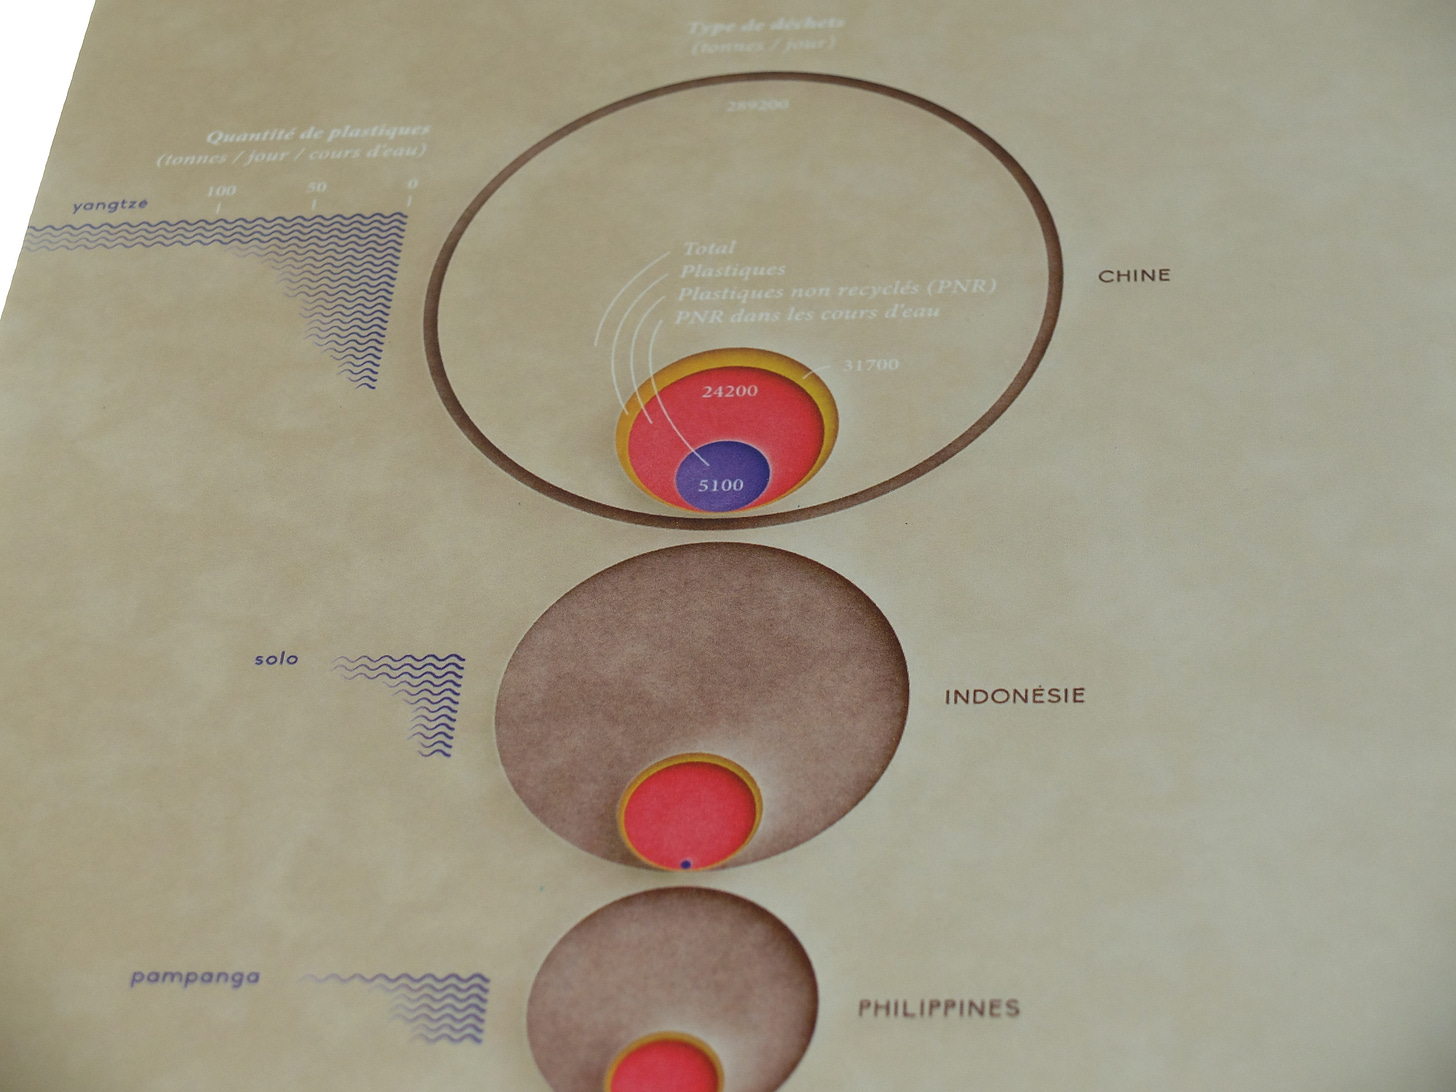
As the first edition went very well, the École de design Nantes Atlantique and the other institutions organising Datarama, the day of conferences on dataviz, suggested that we build a new exhibition for their 7th edition. The theme this time around was data visualisation and emergency. We said yes, and the "Emergency Vizions" exhibition was born. We showcased ten pieces that reflect the emergencies of this world, whether social or environmental. What they all had in common was a human touch to the data.
What do you like most about organising dataviz events like these? What have you learned?
I love all the steps involved in creating a dataviz exhibition. I enjoy choosing the pieces that we will showcase and exchanging with their authors. I also love designing the visual identity for our events, and using for communication on social media. The day of setup, right before show time, comes with its thrills as well. It’s the moment when Florian and I finally meet in person, and see months of our work come to life. During all this, I've learned that nothing is ever lost, how to create something without mastering every little detail, and how to deal with one problem at a time.
How do you decide which designers and artists to reach out for the events? What is the process like?
What counts is not the designer or their reputation, but whether or not the data visualisation corresponds to the theme and fits in nicely with the other pieces. We try to highlight recent, striking projects, created both by women and by men. What matters to us most is the originality of the dataviz, its impact and its message. We usually first choose a long list of several dozen projects, then take another close look at them all and select about ten pieces to exhibit. So far, whenever we’ve reached out to an author of a selected dataviz, they’ve always said yes, and we’re very touched by their confidence in us.
How is printing visualisations for an exhibition different from publishing them online? Any tips for our readers on creating visualisations for print?
From the outset, we select projects that can be adapted to print, but sometimes we ask the author to change certain things so that they are more accessible in person. Such changes can include:
Increasing the size of the text,
Removing transparency effects,
Adding annotations to an initially interactive visual.
We print-test the exhibited pieces a few days before the event, to have time to adjust if necessary. We strongly recommend you do that too when you create a data visualisation for print! Also, do make sure you start out with the right colour palette (CMYK, not RGB) and with the exact dimensions of your canvas (which may be much larger in print than on your screen!).
Do you have a dream artist and/or topic for a future exhibition?
I don't dream of exhibiting anyone. I dream of exhibiting the most suitable visualisation for a given theme. I do have other exhibition topics in mind, always related to social and environmental issues, but whether they’ll see the light of day will depend on the organisations I might collaborate with.
Where can people find the list of art pieces and talks, if they were not able to attend live and would like to take a look now?
You can find the details of the first exhibition on our Behance pages. For the two exhibitions that just came out, you'll have to be a little patient! Follow me on Instagram or Twitter to be the first to hear about the talks and pictures coming out. If you’re very curious right now, you can watch our latest talk here (in 🇫🇷).
Thanks so much to Marthe for taking the time to share her experience and wisdom with us! And thank you for reading The Plot.
As usual, I’ll see you again in two weeks.
Have a lovely weekend!
Evelina


